29
/
en
AIzaSyAYiBZKx7MnpbEhh9jyipgxe19OcubqV5w
April 1, 2024
214286
Norway
NOR
true
2
1
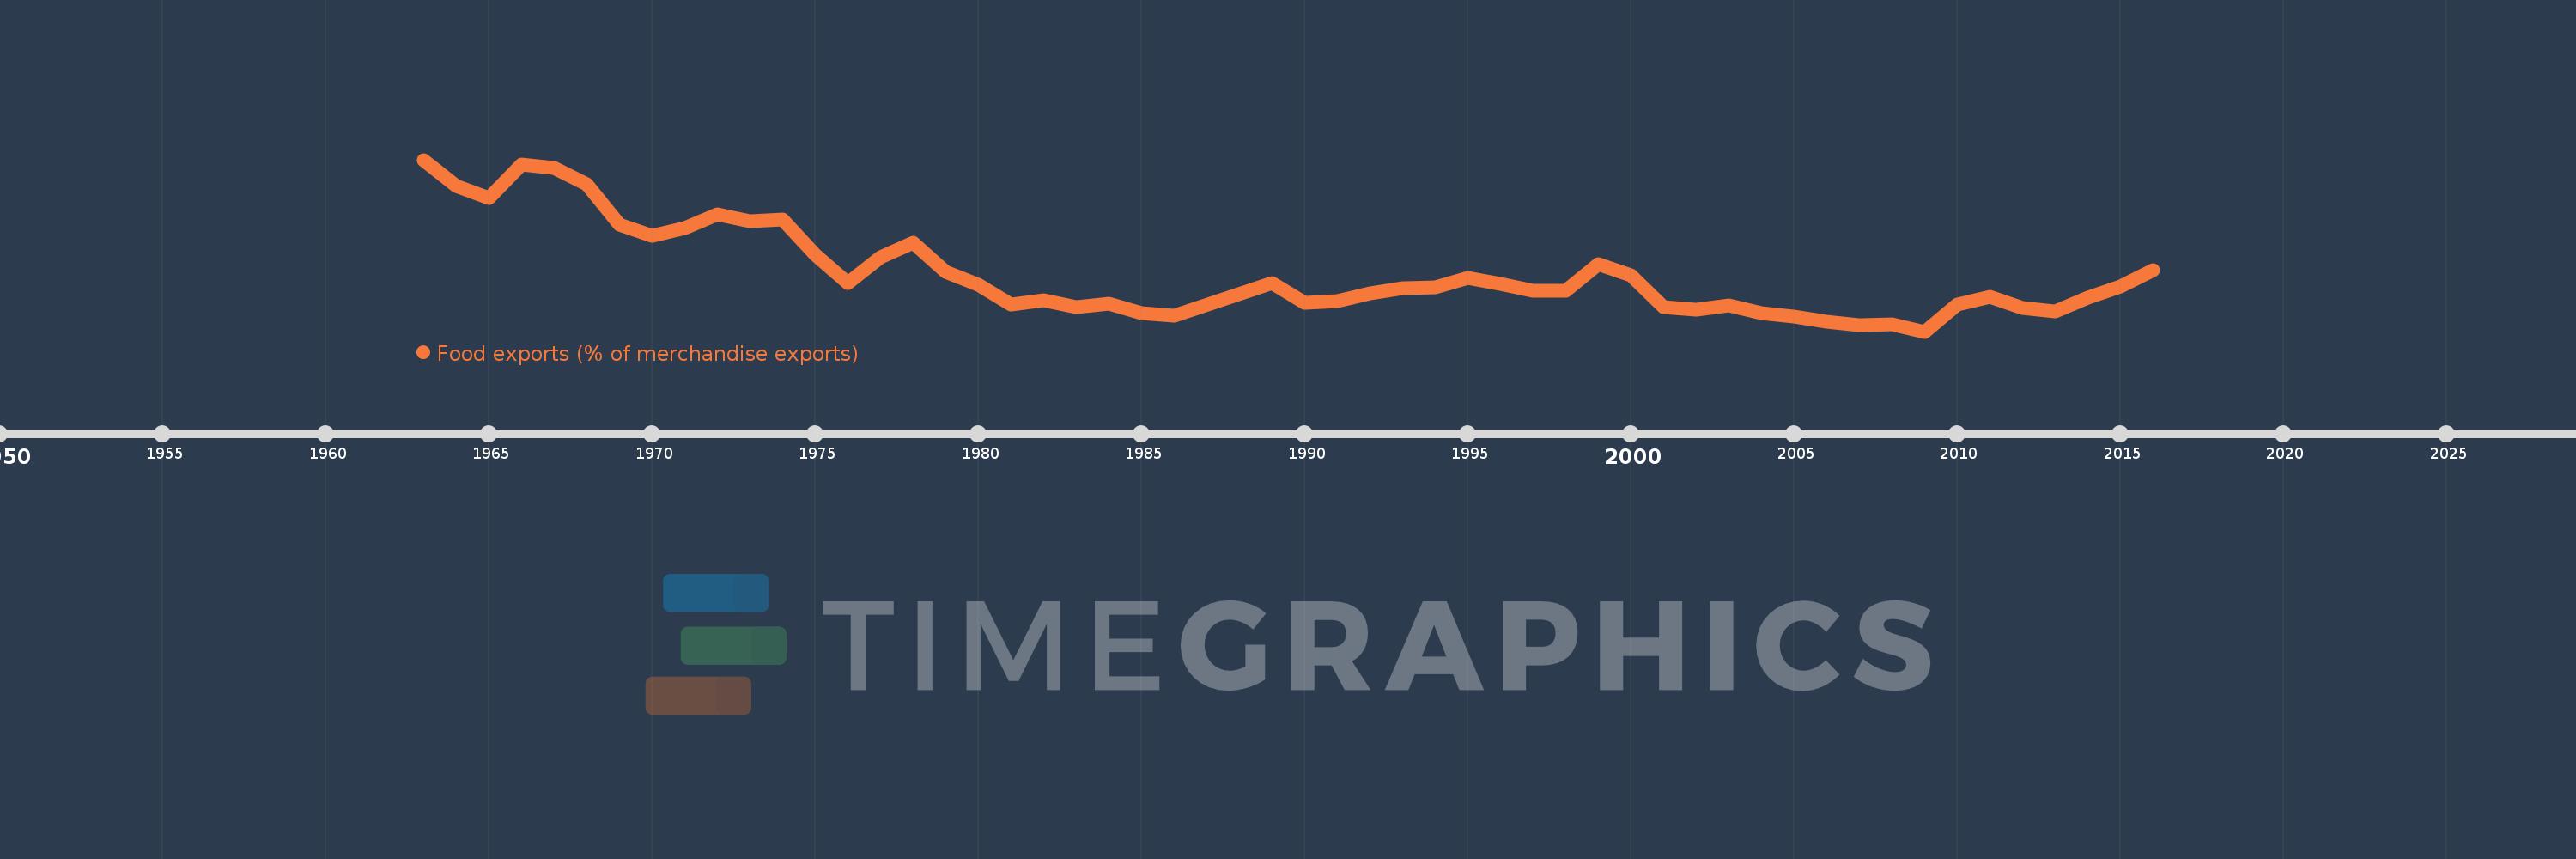
Food exports (% of merchandise exports)
2016,2015,2014,2013,2012,2011,2010,2009,2008,2007,2006,2005,2004,2003,2002,2001,2000,1999,1998,1997,1996,1995,1994,1993,1992,1991,1990,1989,1986,1985,1984,1983,1982,1981,1980,1979,1978,1977,1976,1975,1974,1973,1972,1971,1970,1969,1968,1967,1966,1965,1964,1963
This statistics in other country:
AfghanistanAlbaniaAlgeriaAndorraAngolaAntigua and BarbudaArab WorldArgentinaArmeniaArubaAustraliaAustriaAzerbaijanBahamas, TheBahrainBangladeshBarbadosBelarusBelgiumBelizeBeninBermudaBhutanBoliviaBosnia and HerzegovinaBotswanaBrazilBrunei DarussalamBulgariaBurkina FasoBurundiCabo VerdeCambodiaCameroonCanadaCaribbean small statesCayman IslandsCentral African RepublicCentral Europe and the BalticsChadChileChinaColombiaComorosCongo, Dem. Rep.Congo, Rep.Costa RicaCote d'IvoireCroatiaCubaCyprusCzech RepublicDenmarkDjiboutiDominicaDominican RepublicEarly-demographic dividendEast Asia & PacificEast Asia & Pacific (excluding high income)East Asia & Pacific (IDA & IBRD countries)EcuadorEgypt, Arab Rep.El SalvadorEquatorial GuineaEritreaEstoniaEthiopiaEuro areaEurope & Central AsiaEurope & Central Asia (excluding high income)Europe & Central Asia (IDA & IBRD countries)European UnionFaroe IslandsFijiFinlandFragile and conflict affected situationsFranceFrench PolynesiaGabonGambia, TheGeorgiaGermanyGhanaGreeceGreenlandGrenadaGuatemalaGuineaGuinea-BissauGuyanaHaitiHeavily indebted poor countries (HIPC)High incomeHondurasHong Kong SAR, ChinaHungaryIBRD onlyIcelandIDA & IBRD totalIDA blendIDA onlyIDA totalIndiaIndonesiaIran, Islamic Rep.IraqIrelandIsraelItalyJamaicaJapanJordanKazakhstanKenyaKiribatiKorea, Rep.KuwaitKyrgyz RepublicLao PDRLate-demographic dividendLatin America & Caribbean Latin America & Caribbean (excluding high income)Latin America & the Caribbean (IDA & IBRD countries)LatviaLeast developed countries: UN classificationLebanonLesothoLiberiaLibyaLithuaniaLow & middle incomeLower middle incomeLuxembourgMacao SAR, ChinaMacedonia, FYRMadagascarMalawiMalaysiaMaldivesMaliMaltaMauritaniaMauritiusMexicoMiddle East & North AfricaMiddle East & North Africa (excluding high income)Middle East & North Africa (IDA & IBRD countries)Middle incomeMoldovaMongoliaMoroccoMozambiqueMyanmarNamibiaNepalNetherlandsNew CaledoniaNew ZealandNicaraguaNigerNigeriaNorth AmericaNorwayOECD membersOmanOther small statesPacific island small statesPakistanPalauPanamaPapua New GuineaParaguayPeruPhilippinesPolandPortugalPost-demographic dividendPre-demographic dividendQatarRomaniaRussian FederationRwandaSamoaSao Tome and PrincipeSaudi ArabiaSenegalSerbiaSeychellesSierra LeoneSingaporeSlovak RepublicSloveniaSmall statesSolomon IslandsSomaliaSouth AfricaSouth AsiaSouth Asia (IDA & IBRD)SpainSri LankaSt. Kitts and NevisSt. LuciaSt. Vincent and the GrenadinesSub-Saharan Africa Sub-Saharan Africa (excluding high income)Sub-Saharan Africa (IDA & IBRD countries)SudanSurinameSwazilandSwedenSwitzerlandSyrian Arab RepublicTajikistanTanzaniaThailandTimor-LesteTogoTongaTrinidad and TobagoTunisiaTurkeyTurkmenistanTurks and Caicos IslandsTuvaluUgandaUkraineUnited Arab EmiratesUnited KingdomUnited StatesUpper middle incomeUruguayVanuatuVenezuela, RBVietnamVirgin Islands (U.S.)WorldYemen, Rep.ZambiaZimbabwe Timeline:
This timeline shows a graph from 1963 to 2016 of Norway. No data until 1962. Number of actual observations by date: 52.
Source name:
World Development Indicators
Source organization:
World Bank staff estimates from the Comtrade database maintained by the United Nations Statistics Division.
Categories, topics:
Private Sector, Trade
Last updated:
apr 23, 2017
Indicators value changes by year
Maximum:
18.709
jan 1, 1963
At the date of observation
Value
Absolute change
Change from previous value
jan 1, 1963
18.709
+18.709
0.0%
jan 1, 1964
16.499
-2.21
-11.81%
jan 1, 1965
15.542
-0.957
-5.8%
jan 1, 1966
18.331
+2.789
17.95%
jan 1, 1967
17.994
-0.337
-1.84%
jan 1, 1968
16.639
-1.355
-7.53%
jan 1, 1969
13.29
-3.349
-20.13%
jan 1, 1970
12.357
-0.932
-7.02%
jan 1, 1971
12.998
+0.641
5.19%
jan 1, 1972
14.144
+1.145
8.81%
jan 1, 1973
13.574
-0.569
-4.02%
jan 1, 1974
13.688
+0.114
0.84%
jan 1, 1975
10.791
-2.898
-21.17%
jan 1, 1976
8.449
-2.342
-21.71%
jan 1, 1977
10.54
+2.091
24.75%
jan 1, 1978
11.772
+1.232
11.69%
jan 1, 1979
9.359
-2.413
-20.5%
jan 1, 1980
8.254
-1.105
-11.81%
jan 1, 1981
6.634
-1.62
-19.63%
jan 1, 1982
6.97
+0.336
5.06%
jan 1, 1983
6.401
-0.569
-8.16%
jan 1, 1984
6.711
+0.311
4.86%
jan 1, 1985
5.931
-0.781
-11.64%
jan 1, 1986
5.661
-0.27
-4.55%
jan 1, 1989
8.378
+2.717
48.0%
jan 1, 1990
6.775
-1.603
-19.13%
jan 1, 1991
6.942
+0.167
2.47%
jan 1, 1992
7.562
+0.62
8.93%
jan 1, 1993
7.952
+0.39
5.16%
jan 1, 1994
8.047
+0.095
1.19%
jan 1, 1995
8.846
+0.799
9.93%
jan 1, 1996
8.341
-0.505
-5.71%
jan 1, 1997
7.79
-0.551
-6.6%
jan 1, 1998
7.797
+0.006
0.08%
jan 1, 1999
9.968
+2.171
27.85%
jan 1, 2000
9.05
-0.918
-9.21%
jan 1, 2001
6.391
-2.66
-29.39%
jan 1, 2002
6.199
-0.192
-3.0%
jan 1, 2003
6.562
+0.363
5.85%
jan 1, 2004
5.924
-0.637
-9.71%
jan 1, 2005
5.587
-0.337
-5.69%
jan 1, 2006
5.219
-0.368
-6.58%
jan 1, 2007
4.921
-0.298
-5.71%
jan 1, 2008
5.004
+0.083
1.68%
jan 1, 2009
4.36
-0.644
-12.88%
jan 1, 2010
6.628
+2.269
52.04%
jan 1, 2011
7.238
+0.609
9.19%
jan 1, 2012
6.336
-0.902
-12.46%
jan 1, 2013
6.017
-0.319
-5.04%
jan 1, 2014
7.217
+1.201
19.96%
jan 1, 2015
8.094
+0.877
12.15%
jan 1, 2016
9.486
+1.392
17.19%
Ranking of countries by current statistics by years


Comments: