29
/
en
AIzaSyAYiBZKx7MnpbEhh9jyipgxe19OcubqV5w
April 1, 2024
238235
Seychelles
SYC
true
2
1
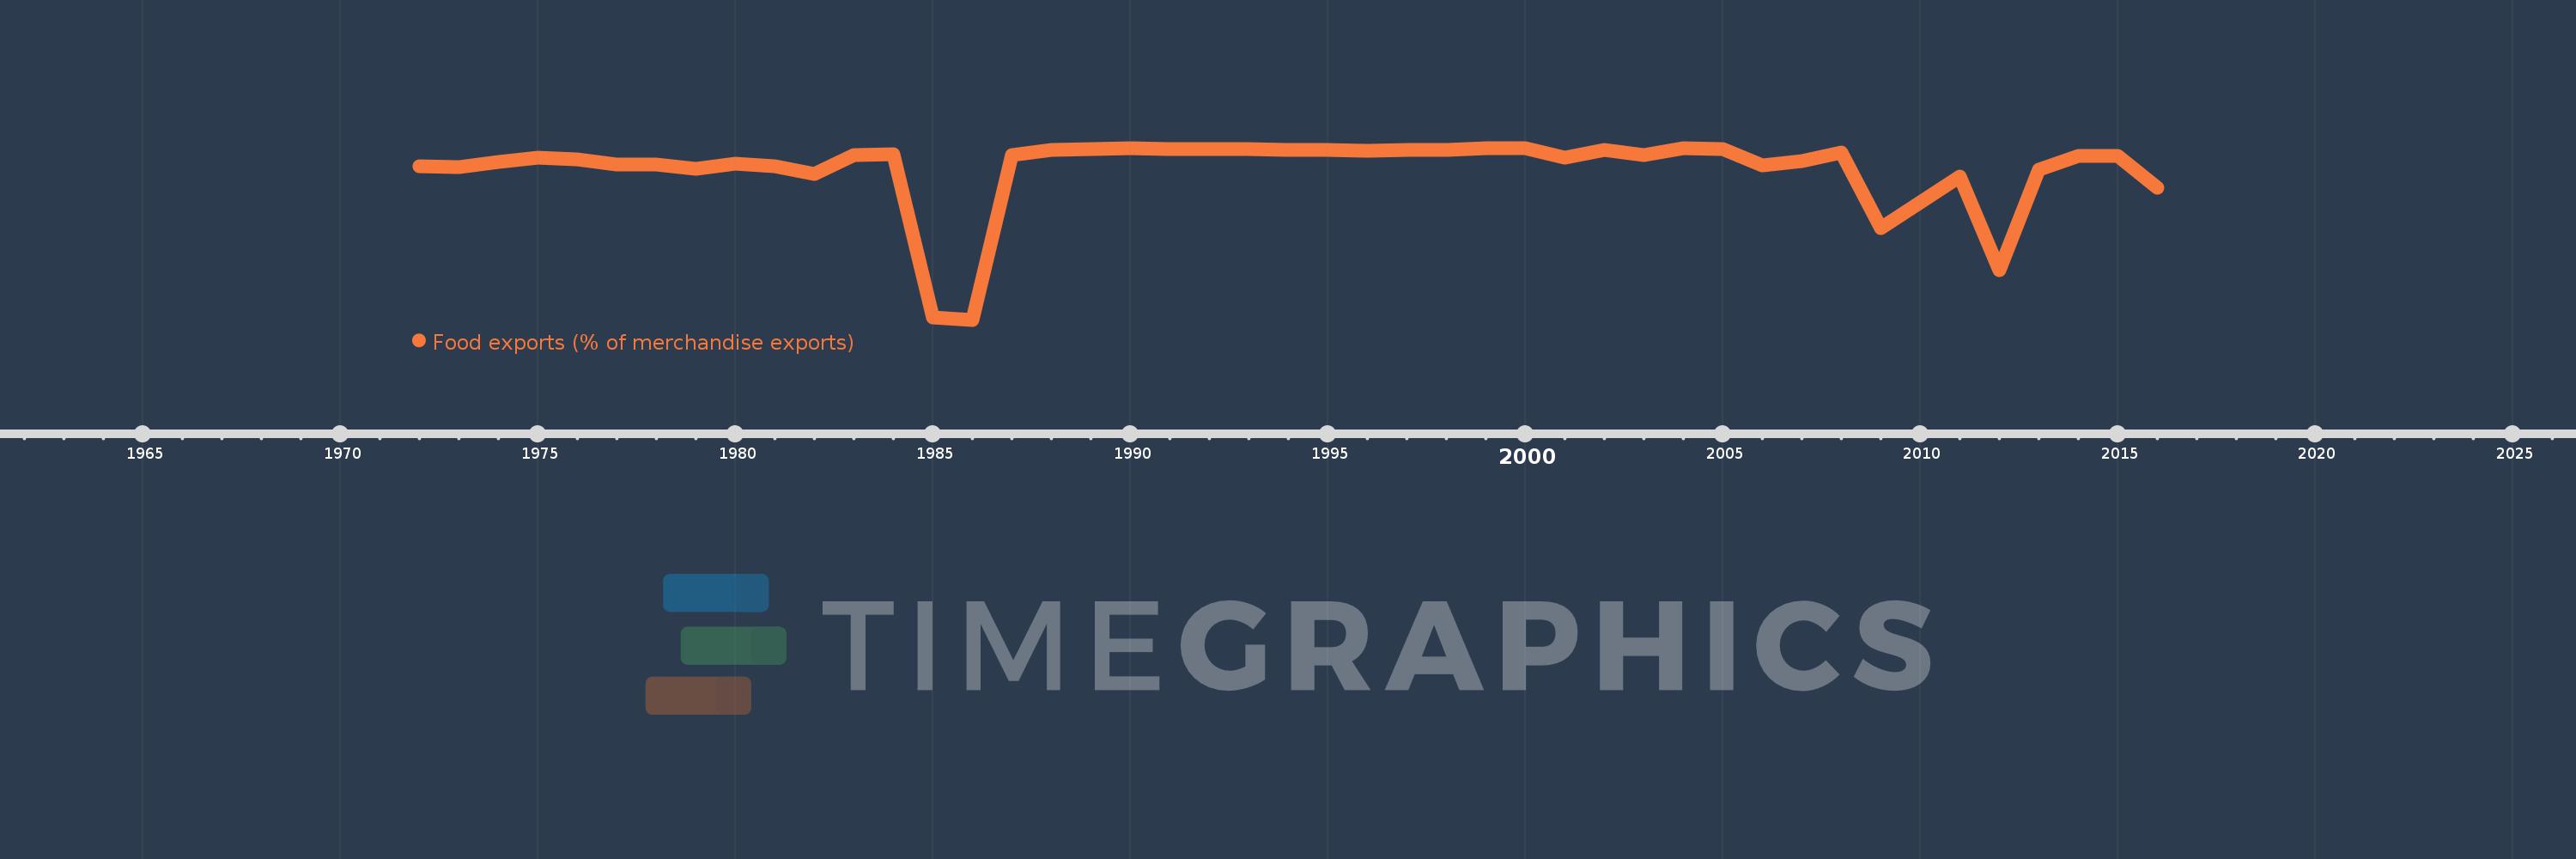
Food exports (% of merchandise exports)
2016,2015,2014,2013,2012,2011,2009,2008,2007,2006,2005,2004,2003,2002,2001,2000,1999,1998,1997,1996,1995,1994,1993,1992,1991,1990,1989,1988,1987,1986,1985,1984,1983,1982,1981,1980,1979,1978,1977,1976,1975,1974,1973,1972
This statistics in other country:
AfghanistanAlbaniaAlgeriaAndorraAngolaAntigua and BarbudaArab WorldArgentinaArmeniaArubaAustraliaAustriaAzerbaijanBahamas, TheBahrainBangladeshBarbadosBelarusBelgiumBelizeBeninBermudaBhutanBoliviaBosnia and HerzegovinaBotswanaBrazilBrunei DarussalamBulgariaBurkina FasoBurundiCabo VerdeCambodiaCameroonCanadaCaribbean small statesCayman IslandsCentral African RepublicCentral Europe and the BalticsChadChileChinaColombiaComorosCongo, Dem. Rep.Congo, Rep.Costa RicaCote d'IvoireCroatiaCubaCyprusCzech RepublicDenmarkDjiboutiDominicaDominican RepublicEarly-demographic dividendEast Asia & PacificEast Asia & Pacific (excluding high income)East Asia & Pacific (IDA & IBRD countries)EcuadorEgypt, Arab Rep.El SalvadorEquatorial GuineaEritreaEstoniaEthiopiaEuro areaEurope & Central AsiaEurope & Central Asia (excluding high income)Europe & Central Asia (IDA & IBRD countries)European UnionFaroe IslandsFijiFinlandFragile and conflict affected situationsFranceFrench PolynesiaGabonGambia, TheGeorgiaGermanyGhanaGreeceGreenlandGrenadaGuatemalaGuineaGuinea-BissauGuyanaHaitiHeavily indebted poor countries (HIPC)High incomeHondurasHong Kong SAR, ChinaHungaryIBRD onlyIcelandIDA & IBRD totalIDA blendIDA onlyIDA totalIndiaIndonesiaIran, Islamic Rep.IraqIrelandIsraelItalyJamaicaJapanJordanKazakhstanKenyaKiribatiKorea, Rep.KuwaitKyrgyz RepublicLao PDRLate-demographic dividendLatin America & Caribbean Latin America & Caribbean (excluding high income)Latin America & the Caribbean (IDA & IBRD countries)LatviaLeast developed countries: UN classificationLebanonLesothoLiberiaLibyaLithuaniaLow & middle incomeLower middle incomeLuxembourgMacao SAR, ChinaMacedonia, FYRMadagascarMalawiMalaysiaMaldivesMaliMaltaMauritaniaMauritiusMexicoMiddle East & North AfricaMiddle East & North Africa (excluding high income)Middle East & North Africa (IDA & IBRD countries)Middle incomeMoldovaMongoliaMoroccoMozambiqueMyanmarNamibiaNepalNetherlandsNew CaledoniaNew ZealandNicaraguaNigerNigeriaNorth AmericaNorwayOECD membersOmanOther small statesPacific island small statesPakistanPalauPanamaPapua New GuineaParaguayPeruPhilippinesPolandPortugalPost-demographic dividendPre-demographic dividendQatarRomaniaRussian FederationRwandaSamoaSao Tome and PrincipeSaudi ArabiaSenegalSerbiaSeychellesSierra LeoneSingaporeSlovak RepublicSloveniaSmall statesSolomon IslandsSomaliaSouth AfricaSouth AsiaSouth Asia (IDA & IBRD)SpainSri LankaSt. Kitts and NevisSt. LuciaSt. Vincent and the GrenadinesSub-Saharan Africa Sub-Saharan Africa (excluding high income)Sub-Saharan Africa (IDA & IBRD countries)SudanSurinameSwazilandSwedenSwitzerlandSyrian Arab RepublicTajikistanTanzaniaThailandTimor-LesteTogoTongaTrinidad and TobagoTunisiaTurkeyTurkmenistanTurks and Caicos IslandsTuvaluUgandaUkraineUnited Arab EmiratesUnited KingdomUnited StatesUpper middle incomeUruguayVanuatuVenezuela, RBVietnamVirgin Islands (U.S.)WorldYemen, Rep.ZambiaZimbabwe Timeline:
This timeline shows a graph from 1972 to 2016 of Seychelles. No data until 1971. Number of actual observations by date: 44.
Source name:
World Development Indicators
Source organization:
World Bank staff estimates from the Comtrade database maintained by the United Nations Statistics Division.
Categories, topics:
Private Sector, Trade
Last updated:
apr 23, 2017
Indicators value changes by year
Minimum:
11.071
jan 1, 1986
At the date of observation
Value
Absolute change
Change from previous value
jan 1, 1972
90.343
+90.343
0.0%
jan 1, 1973
90.22
-0.123
-0.14%
jan 1, 1974
92.692
+2.472
2.74%
jan 1, 1975
95.041
+2.348
2.53%
jan 1, 1976
93.924
-1.117
-1.18%
jan 1, 1977
91.244
-2.68
-2.85%
jan 1, 1978
91.185
-0.059
-0.06%
jan 1, 1979
88.989
-2.196
-2.41%
jan 1, 1980
91.695
+2.706
3.04%
jan 1, 1981
90.697
-0.998
-1.09%
jan 1, 1982
86.631
-4.065
-4.48%
jan 1, 1983
96.386
+9.755
11.26%
jan 1, 1984
96.862
+0.476
0.49%
jan 1, 1985
12.084
-84.778
-87.52%
jan 1, 1986
11.071
-1.013
-8.38%
jan 1, 1987
96.135
+85.064
768.37%
jan 1, 1988
99.049
+2.914
3.03%
jan 1, 1989
99.49
+0.441
0.44%
jan 1, 1990
99.603
+0.113
0.11%
jan 1, 1991
99.434
-0.17
-0.17%
jan 1, 1992
99.582
+0.148
0.15%
jan 1, 1993
99.232
-0.35
-0.35%
jan 1, 1994
98.772
-0.46
-0.46%
jan 1, 1995
98.727
-0.046
-0.05%
jan 1, 1996
98.596
-0.13
-0.13%
jan 1, 1997
99.111
+0.514
0.52%
jan 1, 1998
99.08
-0.031
-0.03%
jan 1, 1999
99.936
+0.856
0.86%
jan 1, 2000
99.94
+0.004
0.0%
jan 1, 2001
94.912
-5.028
-5.03%
jan 1, 2002
98.869
+3.957
4.17%
jan 1, 2003
96.443
-2.426
-2.45%
jan 1, 2004
99.733
+3.29
3.41%
jan 1, 2005
99.491
-0.242
-0.24%
jan 1, 2006
90.829
-8.662
-8.71%
jan 1, 2007
93.184
+2.356
2.59%
jan 1, 2008
97.763
+4.579
4.91%
jan 1, 2009
58.478
-39.285
-40.18%
jan 1, 2011
85.06
+26.582
45.46%
jan 1, 2012
36.871
-48.189
-56.65%
jan 1, 2013
88.544
+51.673
140.15%
jan 1, 2014
95.936
+7.393
8.35%
jan 1, 2015
95.636
-0.301
-0.31%
jan 1, 2016
79.508
-16.128
-16.86%
Ranking of countries by current statistics by years


Comments: