29
/
en
AIzaSyAYiBZKx7MnpbEhh9jyipgxe19OcubqV5w
April 1, 2024
131446
Faroe Islands
FRO
true
2
1
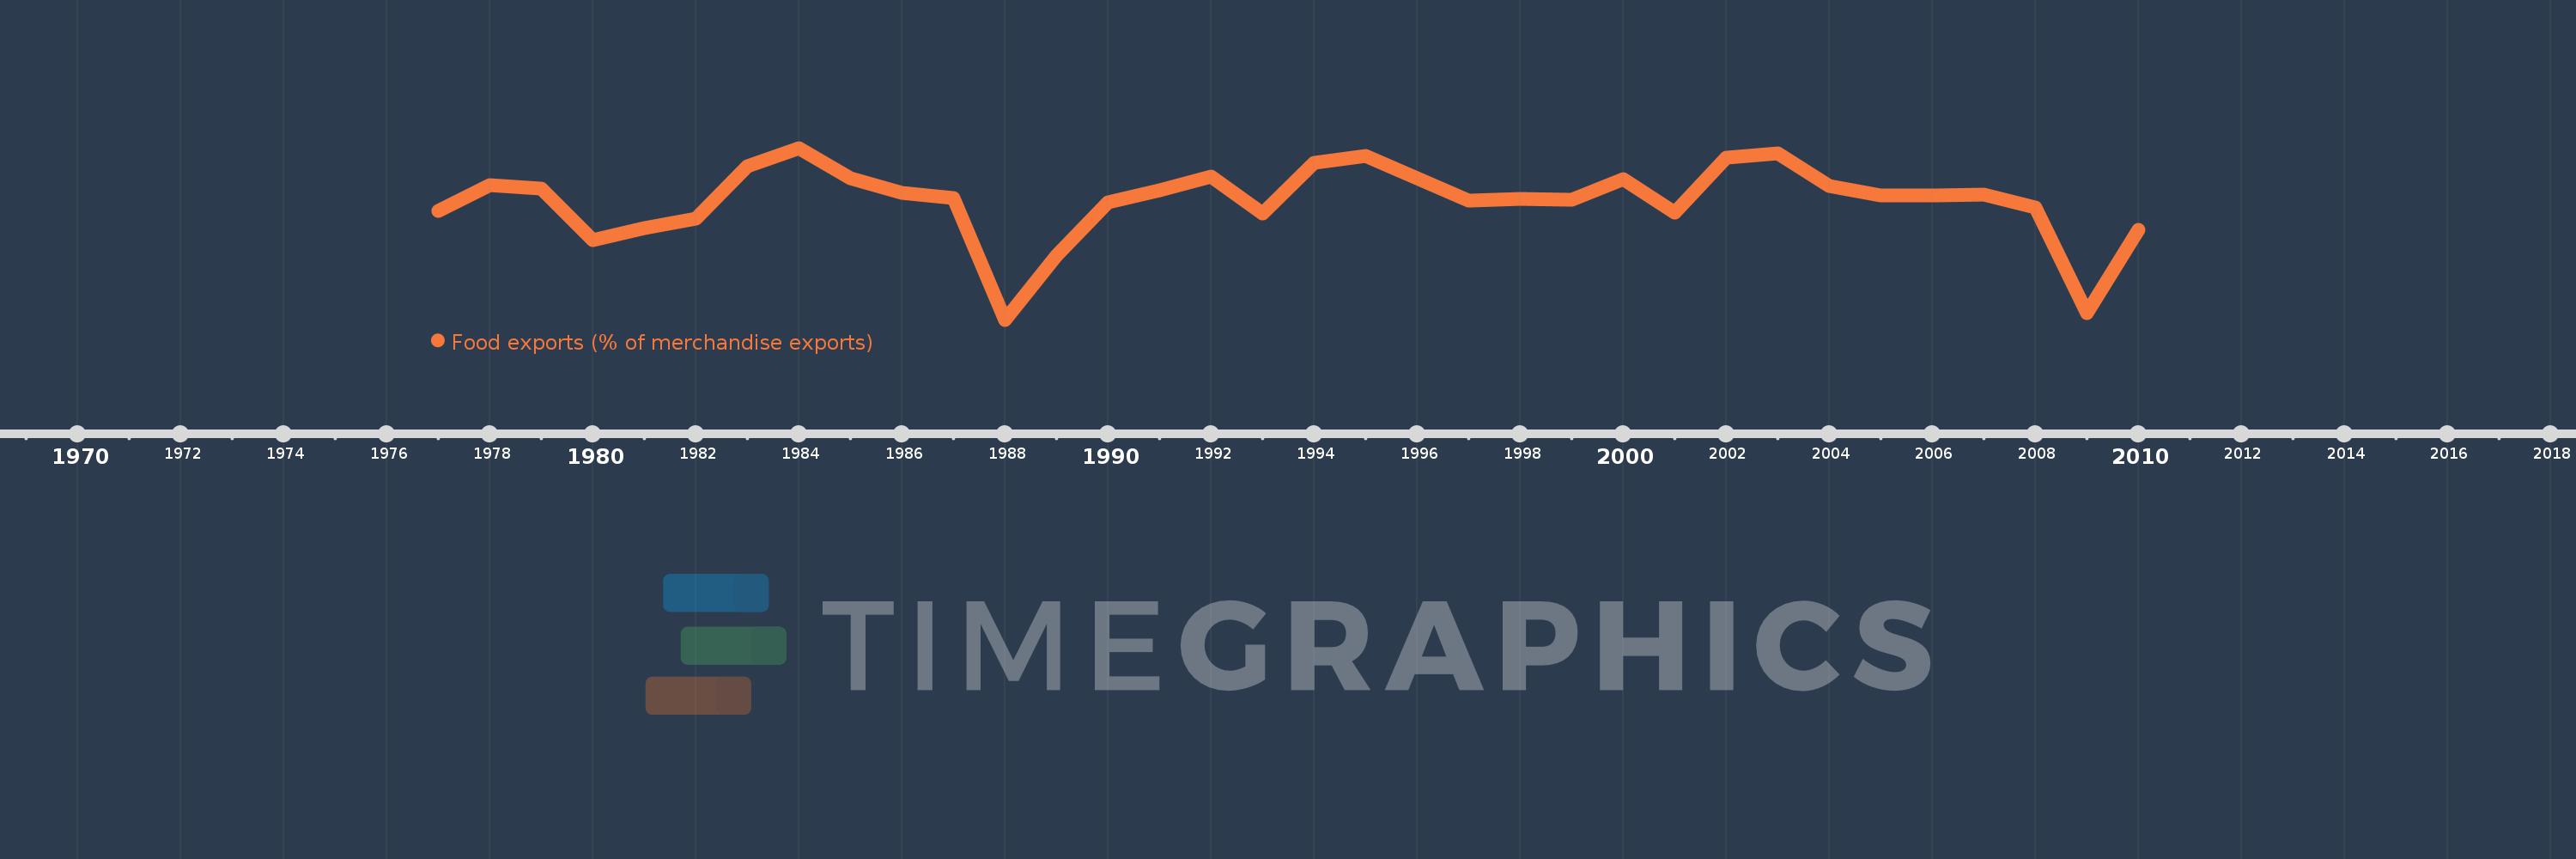
Food exports (% of merchandise exports)
2010,2009,2008,2007,2006,2005,2004,2003,2002,2001,2000,1999,1998,1997,1995,1994,1993,1992,1991,1990,1989,1988,1987,1986,1985,1984,1983,1982,1981,1980,1979,1978,1977
This statistics in other country:
AfghanistanAlbaniaAlgeriaAndorraAngolaAntigua and BarbudaArab WorldArgentinaArmeniaArubaAustraliaAustriaAzerbaijanBahamas, TheBahrainBangladeshBarbadosBelarusBelgiumBelizeBeninBermudaBhutanBoliviaBosnia and HerzegovinaBotswanaBrazilBrunei DarussalamBulgariaBurkina FasoBurundiCabo VerdeCambodiaCameroonCanadaCaribbean small statesCayman IslandsCentral African RepublicCentral Europe and the BalticsChadChileChinaColombiaComorosCongo, Dem. Rep.Congo, Rep.Costa RicaCote d'IvoireCroatiaCubaCyprusCzech RepublicDenmarkDjiboutiDominicaDominican RepublicEarly-demographic dividendEast Asia & PacificEast Asia & Pacific (excluding high income)East Asia & Pacific (IDA & IBRD countries)EcuadorEgypt, Arab Rep.El SalvadorEquatorial GuineaEritreaEstoniaEthiopiaEuro areaEurope & Central AsiaEurope & Central Asia (excluding high income)Europe & Central Asia (IDA & IBRD countries)European UnionFaroe IslandsFijiFinlandFragile and conflict affected situationsFranceFrench PolynesiaGabonGambia, TheGeorgiaGermanyGhanaGreeceGreenlandGrenadaGuatemalaGuineaGuinea-BissauGuyanaHaitiHeavily indebted poor countries (HIPC)High incomeHondurasHong Kong SAR, ChinaHungaryIBRD onlyIcelandIDA & IBRD totalIDA blendIDA onlyIDA totalIndiaIndonesiaIran, Islamic Rep.IraqIrelandIsraelItalyJamaicaJapanJordanKazakhstanKenyaKiribatiKorea, Rep.KuwaitKyrgyz RepublicLao PDRLate-demographic dividendLatin America & Caribbean Latin America & Caribbean (excluding high income)Latin America & the Caribbean (IDA & IBRD countries)LatviaLeast developed countries: UN classificationLebanonLesothoLiberiaLibyaLithuaniaLow & middle incomeLower middle incomeLuxembourgMacao SAR, ChinaMacedonia, FYRMadagascarMalawiMalaysiaMaldivesMaliMaltaMauritaniaMauritiusMexicoMiddle East & North AfricaMiddle East & North Africa (excluding high income)Middle East & North Africa (IDA & IBRD countries)Middle incomeMoldovaMongoliaMoroccoMozambiqueMyanmarNamibiaNepalNetherlandsNew CaledoniaNew ZealandNicaraguaNigerNigeriaNorth AmericaNorwayOECD membersOmanOther small statesPacific island small statesPakistanPalauPanamaPapua New GuineaParaguayPeruPhilippinesPolandPortugalPost-demographic dividendPre-demographic dividendQatarRomaniaRussian FederationRwandaSamoaSao Tome and PrincipeSaudi ArabiaSenegalSerbiaSeychellesSierra LeoneSingaporeSlovak RepublicSloveniaSmall statesSolomon IslandsSomaliaSouth AfricaSouth AsiaSouth Asia (IDA & IBRD)SpainSri LankaSt. Kitts and NevisSt. LuciaSt. Vincent and the GrenadinesSub-Saharan Africa Sub-Saharan Africa (excluding high income)Sub-Saharan Africa (IDA & IBRD countries)SudanSurinameSwazilandSwedenSwitzerlandSyrian Arab RepublicTajikistanTanzaniaThailandTimor-LesteTogoTongaTrinidad and TobagoTunisiaTurkeyTurkmenistanTurks and Caicos IslandsTuvaluUgandaUkraineUnited Arab EmiratesUnited KingdomUnited StatesUpper middle incomeUruguayVanuatuVenezuela, RBVietnamVirgin Islands (U.S.)WorldYemen, Rep.ZambiaZimbabwe Timeline:
This timeline shows a graph from 1977 to 2010 of Faroe Islands. No data until 1976. Number of actual observations by date: 33.
Source name:
World Development Indicators
Source organization:
World Bank staff estimates from the Comtrade database maintained by the United Nations Statistics Division.
Categories, topics:
Private Sector, Trade
Last updated:
apr 23, 2017
Indicators value changes by year
Minimum:
78.444
jan 1, 1988
At the date of observation
Value
Absolute change
Change from previous value
jan 1, 1977
90.036
+90.036
0.0%
jan 1, 1978
92.773
+2.737
3.04%
jan 1, 1979
92.367
-0.406
-0.44%
jan 1, 1980
86.943
-5.424
-5.87%
jan 1, 1981
88.221
+1.279
1.47%
jan 1, 1982
89.176
+0.955
1.08%
jan 1, 1983
94.791
+5.614
6.3%
jan 1, 1984
96.72
+1.93
2.04%
jan 1, 1985
93.539
-3.181
-3.29%
jan 1, 1986
91.976
-1.563
-1.67%
jan 1, 1987
91.387
-0.589
-0.64%
jan 1, 1988
78.444
-12.943
-14.16%
jan 1, 1989
85.315
+6.871
8.76%
jan 1, 1990
90.925
+5.609
6.57%
jan 1, 1991
92.251
+1.326
1.46%
jan 1, 1992
93.691
+1.44
1.56%
jan 1, 1993
89.708
-3.983
-4.25%
jan 1, 1994
95.102
+5.394
6.01%
jan 1, 1995
95.912
+0.81
0.85%
jan 1, 1997
91.144
-4.768
-4.97%
jan 1, 1998
91.283
+0.139
0.15%
jan 1, 1999
91.18
-0.103
-0.11%
jan 1, 2000
93.421
+2.241
2.46%
jan 1, 2001
89.851
-3.57
-3.82%
jan 1, 2002
95.643
+5.792
6.45%
jan 1, 2003
96.132
+0.489
0.51%
jan 1, 2004
92.68
-3.453
-3.59%
jan 1, 2005
91.68
-0.999
-1.08%
jan 1, 2006
91.634
-0.047
-0.05%
jan 1, 2007
91.776
+0.142
0.16%
jan 1, 2008
90.409
-1.367
-1.49%
jan 1, 2009
79.159
-11.249
-12.44%
jan 1, 2010
88.047
+8.887
11.23%
Ranking of countries by current statistics by years


Comments: