29
/
en
AIzaSyAYiBZKx7MnpbEhh9jyipgxe19OcubqV5w
April 1, 2024
258313
Syrian Arab Republic
SYR
true
2
1
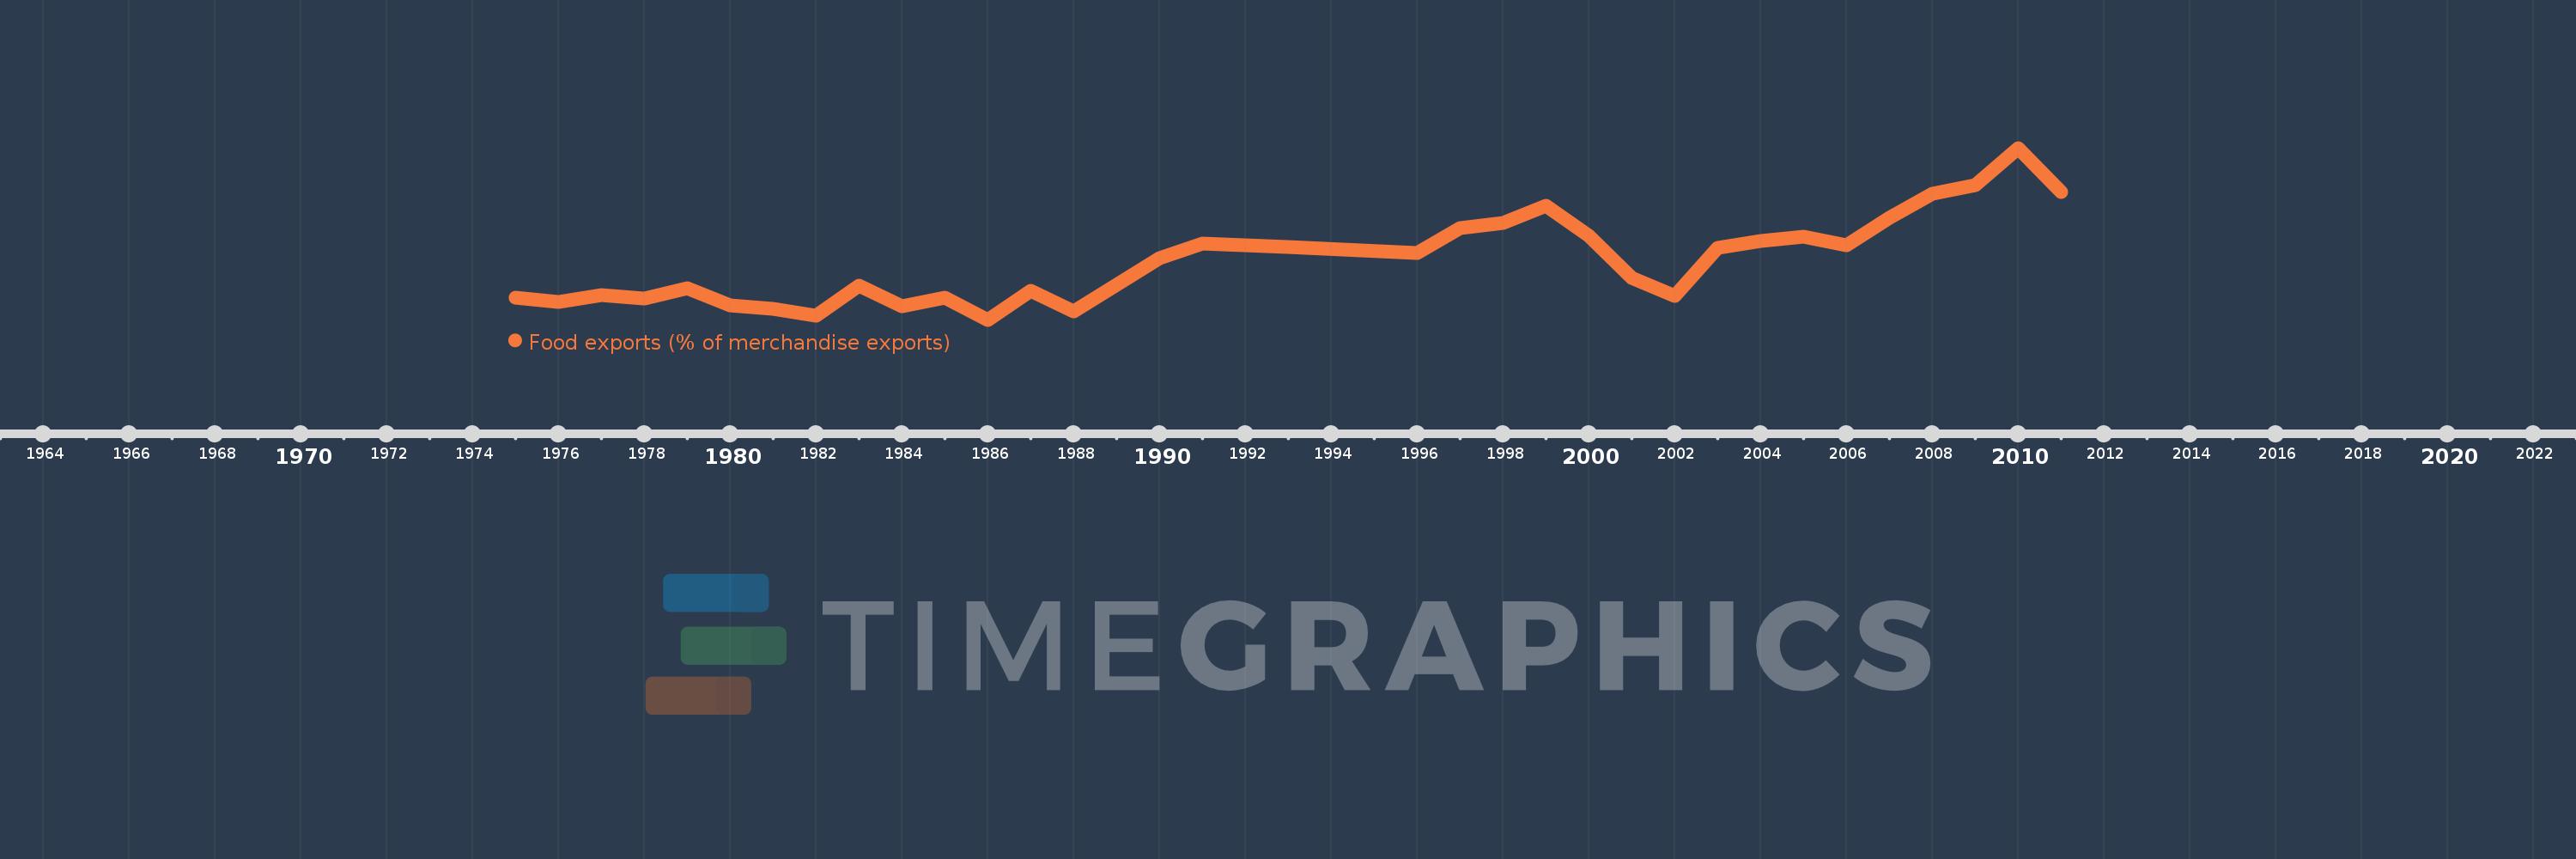
Food exports (% of merchandise exports)
2011,2010,2009,2008,2007,2006,2005,2004,2003,2002,2001,2000,1999,1998,1997,1996,1993,1991,1990,1988,1987,1986,1985,1984,1983,1982,1981,1980,1979,1978,1977,1976,1975
This statistics in other country:
AfghanistanAlbaniaAlgeriaAndorraAngolaAntigua and BarbudaArab WorldArgentinaArmeniaArubaAustraliaAustriaAzerbaijanBahamas, TheBahrainBangladeshBarbadosBelarusBelgiumBelizeBeninBermudaBhutanBoliviaBosnia and HerzegovinaBotswanaBrazilBrunei DarussalamBulgariaBurkina FasoBurundiCabo VerdeCambodiaCameroonCanadaCaribbean small statesCayman IslandsCentral African RepublicCentral Europe and the BalticsChadChileChinaColombiaComorosCongo, Dem. Rep.Congo, Rep.Costa RicaCote d'IvoireCroatiaCubaCyprusCzech RepublicDenmarkDjiboutiDominicaDominican RepublicEarly-demographic dividendEast Asia & PacificEast Asia & Pacific (excluding high income)East Asia & Pacific (IDA & IBRD countries)EcuadorEgypt, Arab Rep.El SalvadorEquatorial GuineaEritreaEstoniaEthiopiaEuro areaEurope & Central AsiaEurope & Central Asia (excluding high income)Europe & Central Asia (IDA & IBRD countries)European UnionFaroe IslandsFijiFinlandFragile and conflict affected situationsFranceFrench PolynesiaGabonGambia, TheGeorgiaGermanyGhanaGreeceGreenlandGrenadaGuatemalaGuineaGuinea-BissauGuyanaHaitiHeavily indebted poor countries (HIPC)High incomeHondurasHong Kong SAR, ChinaHungaryIBRD onlyIcelandIDA & IBRD totalIDA blendIDA onlyIDA totalIndiaIndonesiaIran, Islamic Rep.IraqIrelandIsraelItalyJamaicaJapanJordanKazakhstanKenyaKiribatiKorea, Rep.KuwaitKyrgyz RepublicLao PDRLate-demographic dividendLatin America & Caribbean Latin America & Caribbean (excluding high income)Latin America & the Caribbean (IDA & IBRD countries)LatviaLeast developed countries: UN classificationLebanonLesothoLiberiaLibyaLithuaniaLow & middle incomeLower middle incomeLuxembourgMacao SAR, ChinaMacedonia, FYRMadagascarMalawiMalaysiaMaldivesMaliMaltaMauritaniaMauritiusMexicoMiddle East & North AfricaMiddle East & North Africa (excluding high income)Middle East & North Africa (IDA & IBRD countries)Middle incomeMoldovaMongoliaMoroccoMozambiqueMyanmarNamibiaNepalNetherlandsNew CaledoniaNew ZealandNicaraguaNigerNigeriaNorth AmericaNorwayOECD membersOmanOther small statesPacific island small statesPakistanPalauPanamaPapua New GuineaParaguayPeruPhilippinesPolandPortugalPost-demographic dividendPre-demographic dividendQatarRomaniaRussian FederationRwandaSamoaSao Tome and PrincipeSaudi ArabiaSenegalSerbiaSeychellesSierra LeoneSingaporeSlovak RepublicSloveniaSmall statesSolomon IslandsSomaliaSouth AfricaSouth AsiaSouth Asia (IDA & IBRD)SpainSri LankaSt. Kitts and NevisSt. LuciaSt. Vincent and the GrenadinesSub-Saharan Africa Sub-Saharan Africa (excluding high income)Sub-Saharan Africa (IDA & IBRD countries)SudanSurinameSwazilandSwedenSwitzerlandSyrian Arab RepublicTajikistanTanzaniaThailandTimor-LesteTogoTongaTrinidad and TobagoTunisiaTurkeyTurkmenistanTurks and Caicos IslandsTuvaluUgandaUkraineUnited Arab EmiratesUnited KingdomUnited StatesUpper middle incomeUruguayVanuatuVenezuela, RBVietnamVirgin Islands (U.S.)WorldYemen, Rep.ZambiaZimbabwe Timeline:
This timeline shows a graph from 1975 to 2011 of Syrian Arab Republic. No data until 1974. Number of actual observations by date: 33.
Source name:
World Development Indicators
Source organization:
World Bank staff estimates from the Comtrade database maintained by the United Nations Statistics Division.
Categories, topics:
Private Sector, Trade
Last updated:
apr 23, 2017
Indicators value changes by year
Maximum:
27.336
jan 1, 2010
At the date of observation
Value
Absolute change
Change from previous value
jan 1, 1975
5.962
+5.962
0.0%
jan 1, 1976
5.252
-0.71
-11.91%
jan 1, 1977
6.269
+1.017
19.36%
jan 1, 1978
5.828
-0.441
-7.03%
jan 1, 1979
7.253
+1.425
24.45%
jan 1, 1980
4.768
-2.486
-34.27%
jan 1, 1981
4.314
-0.454
-9.52%
jan 1, 1982
3.292
-1.021
-23.68%
jan 1, 1983
7.681
+4.389
133.31%
jan 1, 1984
4.662
-3.019
-39.31%
jan 1, 1985
5.917
+1.256
26.94%
jan 1, 1986
2.763
-3.154
-53.3%
jan 1, 1987
6.953
+4.189
151.6%
jan 1, 1988
4.006
-2.947
-42.39%
jan 1, 1990
11.548
+7.543
188.3%
jan 1, 1991
13.696
+2.147
18.59%
jan 1, 1993
13.163
-0.533
-3.89%
jan 1, 1996
12.273
-0.889
-6.76%
jan 1, 1997
15.933
+3.659
29.82%
jan 1, 1998
16.622
+0.69
4.33%
jan 1, 1999
19.101
+2.478
14.91%
jan 1, 2000
14.819
-4.282
-22.42%
jan 1, 2001
8.776
-6.043
-40.78%
jan 1, 2002
6.212
-2.564
-29.22%
jan 1, 2003
13.041
+6.829
109.94%
jan 1, 2004
14.002
+0.961
7.37%
jan 1, 2005
14.678
+0.676
4.83%
jan 1, 2006
13.384
-1.294
-8.82%
jan 1, 2007
17.381
+3.997
29.86%
jan 1, 2008
20.794
+3.413
19.64%
jan 1, 2009
21.955
+1.161
5.58%
jan 1, 2010
27.336
+5.381
24.51%
jan 1, 2011
21.012
-6.324
-23.13%
Ranking of countries by current statistics by years


Comments: