29
/
en
AIzaSyAYiBZKx7MnpbEhh9jyipgxe19OcubqV5w
April 1, 2024
69788
Argentina
ARG
true
2
1
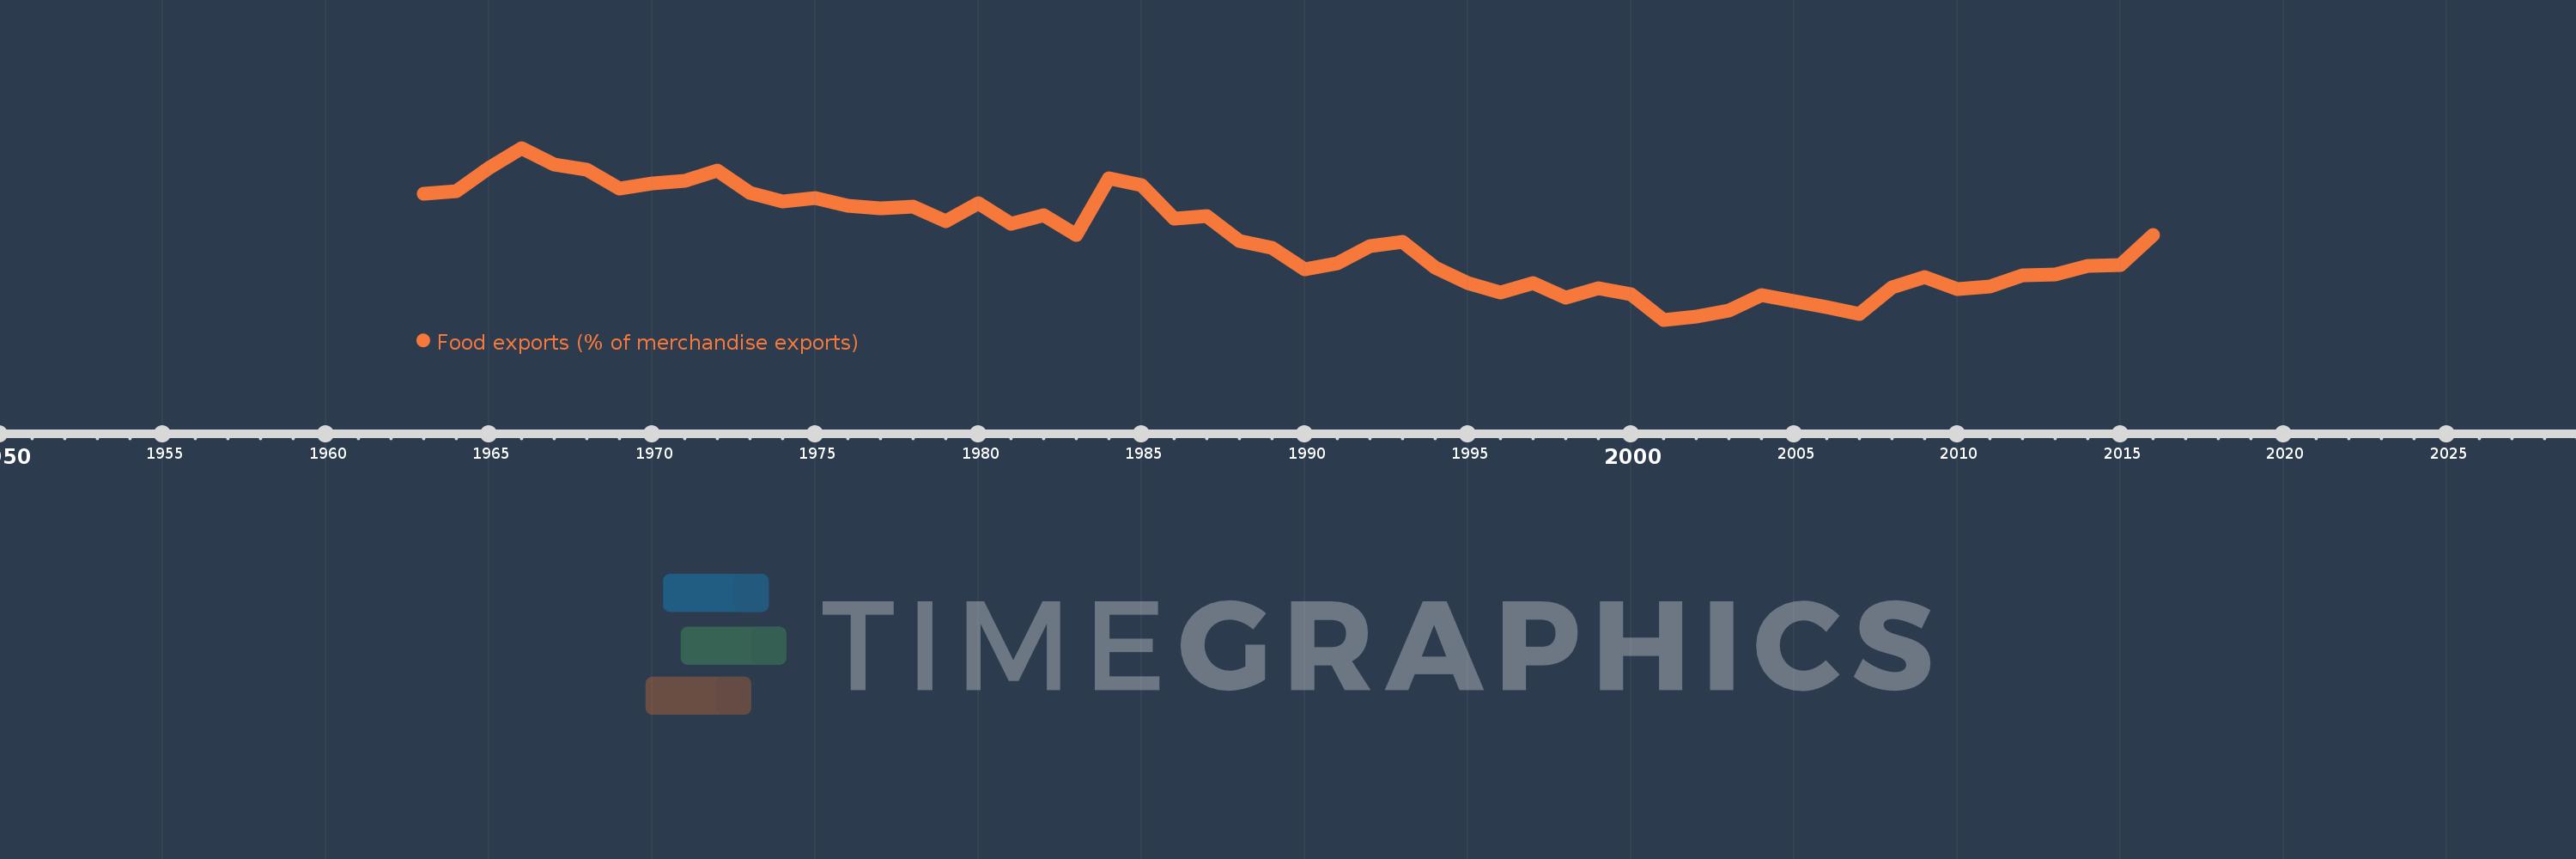
Food exports (% of merchandise exports)
2016,2015,2014,2013,2012,2011,2010,2009,2008,2007,2006,2005,2004,2003,2002,2001,2000,1999,1998,1997,1996,1995,1994,1993,1992,1991,1990,1989,1988,1987,1986,1985,1984,1983,1982,1981,1980,1979,1978,1977,1976,1975,1974,1973,1972,1971,1970,1969,1968,1967,1966,1965,1964,1963
This statistics in other country:
AfghanistanAlbaniaAlgeriaAndorraAngolaAntigua and BarbudaArab WorldArgentinaArmeniaArubaAustraliaAustriaAzerbaijanBahamas, TheBahrainBangladeshBarbadosBelarusBelgiumBelizeBeninBermudaBhutanBoliviaBosnia and HerzegovinaBotswanaBrazilBrunei DarussalamBulgariaBurkina FasoBurundiCabo VerdeCambodiaCameroonCanadaCaribbean small statesCayman IslandsCentral African RepublicCentral Europe and the BalticsChadChileChinaColombiaComorosCongo, Dem. Rep.Congo, Rep.Costa RicaCote d'IvoireCroatiaCubaCyprusCzech RepublicDenmarkDjiboutiDominicaDominican RepublicEarly-demographic dividendEast Asia & PacificEast Asia & Pacific (excluding high income)East Asia & Pacific (IDA & IBRD countries)EcuadorEgypt, Arab Rep.El SalvadorEquatorial GuineaEritreaEstoniaEthiopiaEuro areaEurope & Central AsiaEurope & Central Asia (excluding high income)Europe & Central Asia (IDA & IBRD countries)European UnionFaroe IslandsFijiFinlandFragile and conflict affected situationsFranceFrench PolynesiaGabonGambia, TheGeorgiaGermanyGhanaGreeceGreenlandGrenadaGuatemalaGuineaGuinea-BissauGuyanaHaitiHeavily indebted poor countries (HIPC)High incomeHondurasHong Kong SAR, ChinaHungaryIBRD onlyIcelandIDA & IBRD totalIDA blendIDA onlyIDA totalIndiaIndonesiaIran, Islamic Rep.IraqIrelandIsraelItalyJamaicaJapanJordanKazakhstanKenyaKiribatiKorea, Rep.KuwaitKyrgyz RepublicLao PDRLate-demographic dividendLatin America & Caribbean Latin America & Caribbean (excluding high income)Latin America & the Caribbean (IDA & IBRD countries)LatviaLeast developed countries: UN classificationLebanonLesothoLiberiaLibyaLithuaniaLow & middle incomeLower middle incomeLuxembourgMacao SAR, ChinaMacedonia, FYRMadagascarMalawiMalaysiaMaldivesMaliMaltaMauritaniaMauritiusMexicoMiddle East & North AfricaMiddle East & North Africa (excluding high income)Middle East & North Africa (IDA & IBRD countries)Middle incomeMoldovaMongoliaMoroccoMozambiqueMyanmarNamibiaNepalNetherlandsNew CaledoniaNew ZealandNicaraguaNigerNigeriaNorth AmericaNorwayOECD membersOmanOther small statesPacific island small statesPakistanPalauPanamaPapua New GuineaParaguayPeruPhilippinesPolandPortugalPost-demographic dividendPre-demographic dividendQatarRomaniaRussian FederationRwandaSamoaSao Tome and PrincipeSaudi ArabiaSenegalSerbiaSeychellesSierra LeoneSingaporeSlovak RepublicSloveniaSmall statesSolomon IslandsSomaliaSouth AfricaSouth AsiaSouth Asia (IDA & IBRD)SpainSri LankaSt. Kitts and NevisSt. LuciaSt. Vincent and the GrenadinesSub-Saharan Africa Sub-Saharan Africa (excluding high income)Sub-Saharan Africa (IDA & IBRD countries)SudanSurinameSwazilandSwedenSwitzerlandSyrian Arab RepublicTajikistanTanzaniaThailandTimor-LesteTogoTongaTrinidad and TobagoTunisiaTurkeyTurkmenistanTurks and Caicos IslandsTuvaluUgandaUkraineUnited Arab EmiratesUnited KingdomUnited StatesUpper middle incomeUruguayVanuatuVenezuela, RBVietnamVirgin Islands (U.S.)WorldYemen, Rep.ZambiaZimbabwe Timeline:
This timeline shows a graph from 1963 to 2016 of Argentina. No data until 1962. Number of actual observations by date: 54.
Source name:
World Development Indicators
Source organization:
World Bank staff estimates from the Comtrade database maintained by the United Nations Statistics Division.
Categories, topics:
Private Sector, Trade
Last updated:
apr 23, 2017
Indicators value changes by year
Minimum:
43.779
jan 1, 2001
Maximum:
81.635
jan 1, 1966
At the date of observation
Value
Absolute change
Change from previous value
jan 1, 1963
71.517
+71.517
0.0%
jan 1, 1964
72.124
+0.607
0.85%
jan 1, 1965
77.227
+5.102
7.07%
jan 1, 1966
81.635
+4.409
5.71%
jan 1, 1967
77.918
-3.717
-4.55%
jan 1, 1968
76.83
-1.088
-1.4%
jan 1, 1969
72.74
-4.09
-5.32%
jan 1, 1970
73.876
+1.136
1.56%
jan 1, 1971
74.318
+0.443
0.6%
jan 1, 1972
76.699
+2.381
3.2%
jan 1, 1973
71.754
-4.945
-6.45%
jan 1, 1974
69.907
-1.847
-2.57%
jan 1, 1975
70.517
+0.61
0.87%
jan 1, 1976
68.869
-1.648
-2.34%
jan 1, 1977
68.243
-0.626
-0.91%
jan 1, 1978
68.788
+0.545
0.8%
jan 1, 1979
65.446
-3.342
-4.86%
jan 1, 1980
69.401
+3.955
6.04%
jan 1, 1981
64.955
-4.446
-6.41%
jan 1, 1982
66.836
+1.881
2.9%
jan 1, 1983
62.513
-4.323
-6.47%
jan 1, 1984
74.969
+12.455
19.92%
jan 1, 1985
73.402
-1.567
-2.09%
jan 1, 1986
66.071
-7.331
-9.99%
jan 1, 1987
66.628
+0.558
0.84%
jan 1, 1988
61.059
-5.569
-8.36%
jan 1, 1989
59.639
-1.42
-2.33%
jan 1, 1990
54.981
-4.658
-7.81%
jan 1, 1991
56.256
+1.275
2.32%
jan 1, 1992
60.052
+3.796
6.75%
jan 1, 1993
61.008
+0.956
1.59%
jan 1, 1994
55.299
-5.709
-9.36%
jan 1, 1995
51.93
-3.369
-6.09%
jan 1, 1996
49.786
-2.144
-4.13%
jan 1, 1997
51.923
+2.137
4.29%
jan 1, 1998
48.601
-3.322
-6.4%
jan 1, 1999
50.647
+2.046
4.21%
jan 1, 2000
49.394
-1.253
-2.47%
jan 1, 2001
43.779
-5.615
-11.37%
jan 1, 2002
44.393
+0.614
1.4%
jan 1, 2003
45.878
+1.485
3.34%
jan 1, 2004
49.205
+3.327
7.25%
jan 1, 2005
47.959
-1.246
-2.53%
jan 1, 2006
46.619
-1.34
-2.79%
jan 1, 2007
45.119
-1.5
-3.22%
jan 1, 2008
50.905
+5.786
12.82%
jan 1, 2009
53.116
+2.211
4.34%
jan 1, 2010
50.489
-2.627
-4.94%
jan 1, 2011
51.139
+0.65
1.29%
jan 1, 2012
53.637
+2.497
4.88%
jan 1, 2013
53.663
+0.027
0.05%
jan 1, 2014
55.739
+2.076
3.87%
jan 1, 2015
55.811
+0.072
0.13%
jan 1, 2016
62.389
+6.579
11.79%
Ranking of countries by current statistics by years


Comments: