29
/
en
AIzaSyAYiBZKx7MnpbEhh9jyipgxe19OcubqV5w
April 1, 2024
87204
Bolivia
BOL
true
2
1
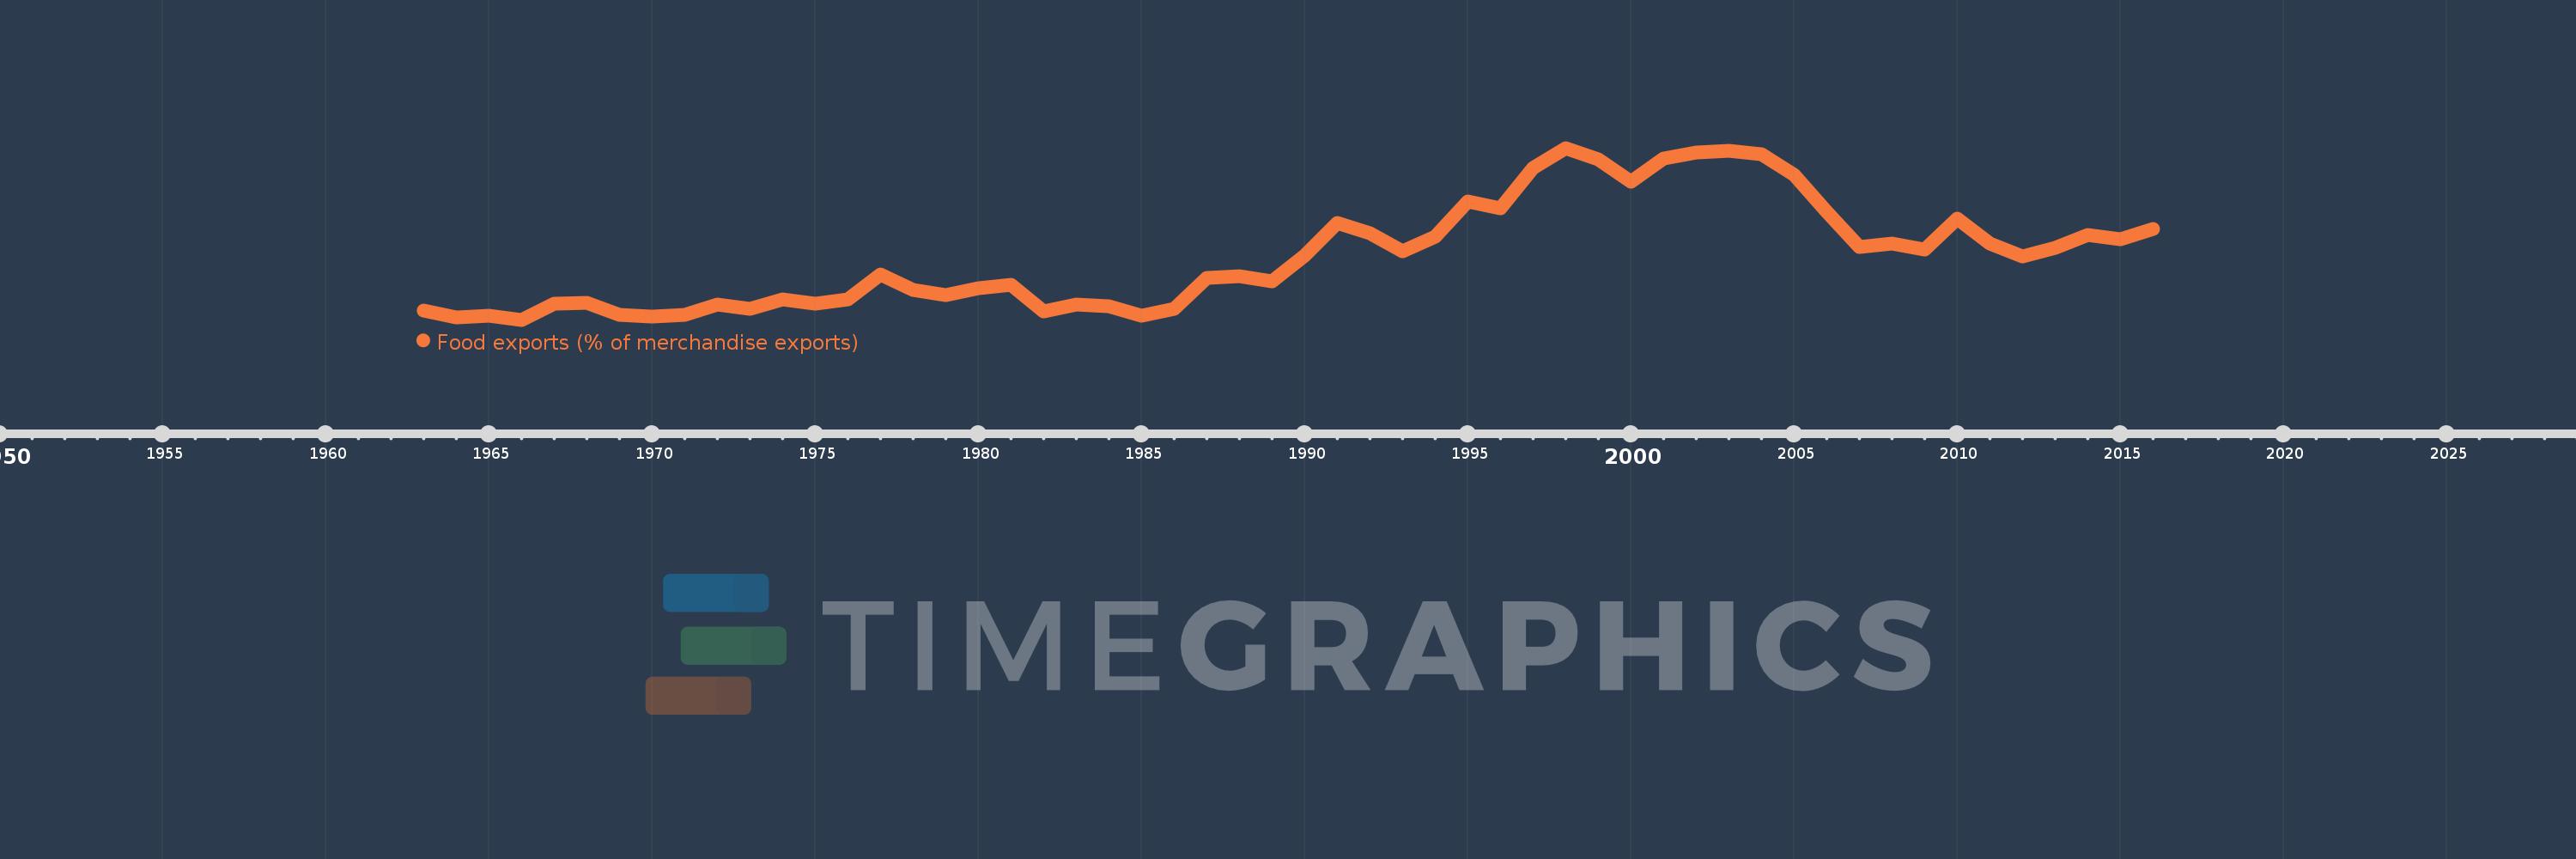
Food exports (% of merchandise exports)
2016,2015,2014,2013,2012,2011,2010,2009,2008,2007,2006,2005,2004,2003,2002,2001,2000,1999,1998,1997,1996,1995,1994,1993,1992,1991,1990,1989,1988,1987,1986,1985,1984,1983,1982,1981,1980,1979,1978,1977,1976,1975,1974,1973,1972,1971,1970,1969,1968,1967,1966,1965,1964,1963
This statistics in other country:
AfghanistanAlbaniaAlgeriaAndorraAngolaAntigua and BarbudaArab WorldArgentinaArmeniaArubaAustraliaAustriaAzerbaijanBahamas, TheBahrainBangladeshBarbadosBelarusBelgiumBelizeBeninBermudaBhutanBoliviaBosnia and HerzegovinaBotswanaBrazilBrunei DarussalamBulgariaBurkina FasoBurundiCabo VerdeCambodiaCameroonCanadaCaribbean small statesCayman IslandsCentral African RepublicCentral Europe and the BalticsChadChileChinaColombiaComorosCongo, Dem. Rep.Congo, Rep.Costa RicaCote d'IvoireCroatiaCubaCyprusCzech RepublicDenmarkDjiboutiDominicaDominican RepublicEarly-demographic dividendEast Asia & PacificEast Asia & Pacific (excluding high income)East Asia & Pacific (IDA & IBRD countries)EcuadorEgypt, Arab Rep.El SalvadorEquatorial GuineaEritreaEstoniaEthiopiaEuro areaEurope & Central AsiaEurope & Central Asia (excluding high income)Europe & Central Asia (IDA & IBRD countries)European UnionFaroe IslandsFijiFinlandFragile and conflict affected situationsFranceFrench PolynesiaGabonGambia, TheGeorgiaGermanyGhanaGreeceGreenlandGrenadaGuatemalaGuineaGuinea-BissauGuyanaHaitiHeavily indebted poor countries (HIPC)High incomeHondurasHong Kong SAR, ChinaHungaryIBRD onlyIcelandIDA & IBRD totalIDA blendIDA onlyIDA totalIndiaIndonesiaIran, Islamic Rep.IraqIrelandIsraelItalyJamaicaJapanJordanKazakhstanKenyaKiribatiKorea, Rep.KuwaitKyrgyz RepublicLao PDRLate-demographic dividendLatin America & Caribbean Latin America & Caribbean (excluding high income)Latin America & the Caribbean (IDA & IBRD countries)LatviaLeast developed countries: UN classificationLebanonLesothoLiberiaLibyaLithuaniaLow & middle incomeLower middle incomeLuxembourgMacao SAR, ChinaMacedonia, FYRMadagascarMalawiMalaysiaMaldivesMaliMaltaMauritaniaMauritiusMexicoMiddle East & North AfricaMiddle East & North Africa (excluding high income)Middle East & North Africa (IDA & IBRD countries)Middle incomeMoldovaMongoliaMoroccoMozambiqueMyanmarNamibiaNepalNetherlandsNew CaledoniaNew ZealandNicaraguaNigerNigeriaNorth AmericaNorwayOECD membersOmanOther small statesPacific island small statesPakistanPalauPanamaPapua New GuineaParaguayPeruPhilippinesPolandPortugalPost-demographic dividendPre-demographic dividendQatarRomaniaRussian FederationRwandaSamoaSao Tome and PrincipeSaudi ArabiaSenegalSerbiaSeychellesSierra LeoneSingaporeSlovak RepublicSloveniaSmall statesSolomon IslandsSomaliaSouth AfricaSouth AsiaSouth Asia (IDA & IBRD)SpainSri LankaSt. Kitts and NevisSt. LuciaSt. Vincent and the GrenadinesSub-Saharan Africa Sub-Saharan Africa (excluding high income)Sub-Saharan Africa (IDA & IBRD countries)SudanSurinameSwazilandSwedenSwitzerlandSyrian Arab RepublicTajikistanTanzaniaThailandTimor-LesteTogoTongaTrinidad and TobagoTunisiaTurkeyTurkmenistanTurks and Caicos IslandsTuvaluUgandaUkraineUnited Arab EmiratesUnited KingdomUnited StatesUpper middle incomeUruguayVanuatuVenezuela, RBVietnamVirgin Islands (U.S.)WorldYemen, Rep.ZambiaZimbabwe Timeline:
This timeline shows a graph from 1963 to 2016 of Bolivia. No data until 1962. Number of actual observations by date: 54.
Source name:
World Development Indicators
Source organization:
World Bank staff estimates from the Comtrade database maintained by the United Nations Statistics Division.
Categories, topics:
Private Sector, Trade
Last updated:
apr 23, 2017
Indicators value changes by year
Maximum:
32.117
jan 1, 1998
At the date of observation
Value
Absolute change
Change from previous value
jan 1, 1963
3.429
+3.429
0.0%
jan 1, 1964
2.266
-1.163
-33.92%
jan 1, 1965
2.532
+0.266
11.74%
jan 1, 1966
1.807
-0.725
-28.64%
jan 1, 1967
4.572
+2.765
153.02%
jan 1, 1968
4.771
+0.199
4.36%
jan 1, 1969
2.622
-2.149
-45.04%
jan 1, 1970
2.421
-0.201
-7.66%
jan 1, 1971
2.691
+0.27
11.14%
jan 1, 1972
4.508
+1.817
67.53%
jan 1, 1973
3.77
-0.738
-16.37%
jan 1, 1974
5.396
+1.626
43.13%
jan 1, 1975
4.6
-0.796
-14.75%
jan 1, 1976
5.35
+0.751
16.32%
jan 1, 1977
9.8
+4.449
83.16%
jan 1, 1978
7.005
-2.795
-28.52%
jan 1, 1979
6.138
-0.867
-12.37%
jan 1, 1980
7.415
+1.277
20.81%
jan 1, 1981
8.017
+0.602
8.12%
jan 1, 1982
3.287
-4.73
-59.0%
jan 1, 1983
4.418
+1.131
34.41%
jan 1, 1984
4.231
-0.187
-4.23%
jan 1, 1985
2.584
-1.647
-38.93%
jan 1, 1986
3.744
+1.16
44.9%
jan 1, 1987
9.167
+5.423
144.83%
jan 1, 1988
9.498
+0.331
3.61%
jan 1, 1989
8.584
-0.914
-9.62%
jan 1, 1990
13.163
+4.579
53.34%
jan 1, 1991
18.946
+5.783
43.94%
jan 1, 1992
17.004
-1.942
-10.25%
jan 1, 1993
13.944
-3.06
-18.0%
jan 1, 1994
16.536
+2.592
18.59%
jan 1, 1995
22.609
+6.073
36.72%
jan 1, 1996
21.476
-1.133
-5.01%
jan 1, 1997
28.633
+7.156
33.32%
jan 1, 1998
32.117
+3.485
12.17%
jan 1, 1999
30.03
-2.087
-6.5%
jan 1, 2000
26.199
-3.831
-12.76%
jan 1, 2001
30.248
+4.05
15.46%
jan 1, 2002
31.357
+1.109
3.67%
jan 1, 2003
31.672
+0.315
1.01%
jan 1, 2004
30.94
-0.732
-2.31%
jan 1, 2005
27.365
-3.575
-11.56%
jan 1, 2006
20.812
-6.553
-23.95%
jan 1, 2007
14.661
-6.151
-29.56%
jan 1, 2008
15.308
+0.647
4.42%
jan 1, 2009
14.208
-1.1
-7.19%
jan 1, 2010
19.62
+5.412
38.09%
jan 1, 2011
15.27
-4.35
-22.17%
jan 1, 2012
12.904
-2.366
-15.5%
jan 1, 2013
14.522
+1.618
12.54%
jan 1, 2014
16.807
+2.285
15.73%
jan 1, 2015
15.94
-0.866
-5.16%
jan 1, 2016
17.76
+1.82
11.42%
Ranking of countries by current statistics by years


Comments: