29
/
en
AIzaSyAYiBZKx7MnpbEhh9jyipgxe19OcubqV5w
April 1, 2024
37341
IDA & IBRD total
IBT
false
2
1
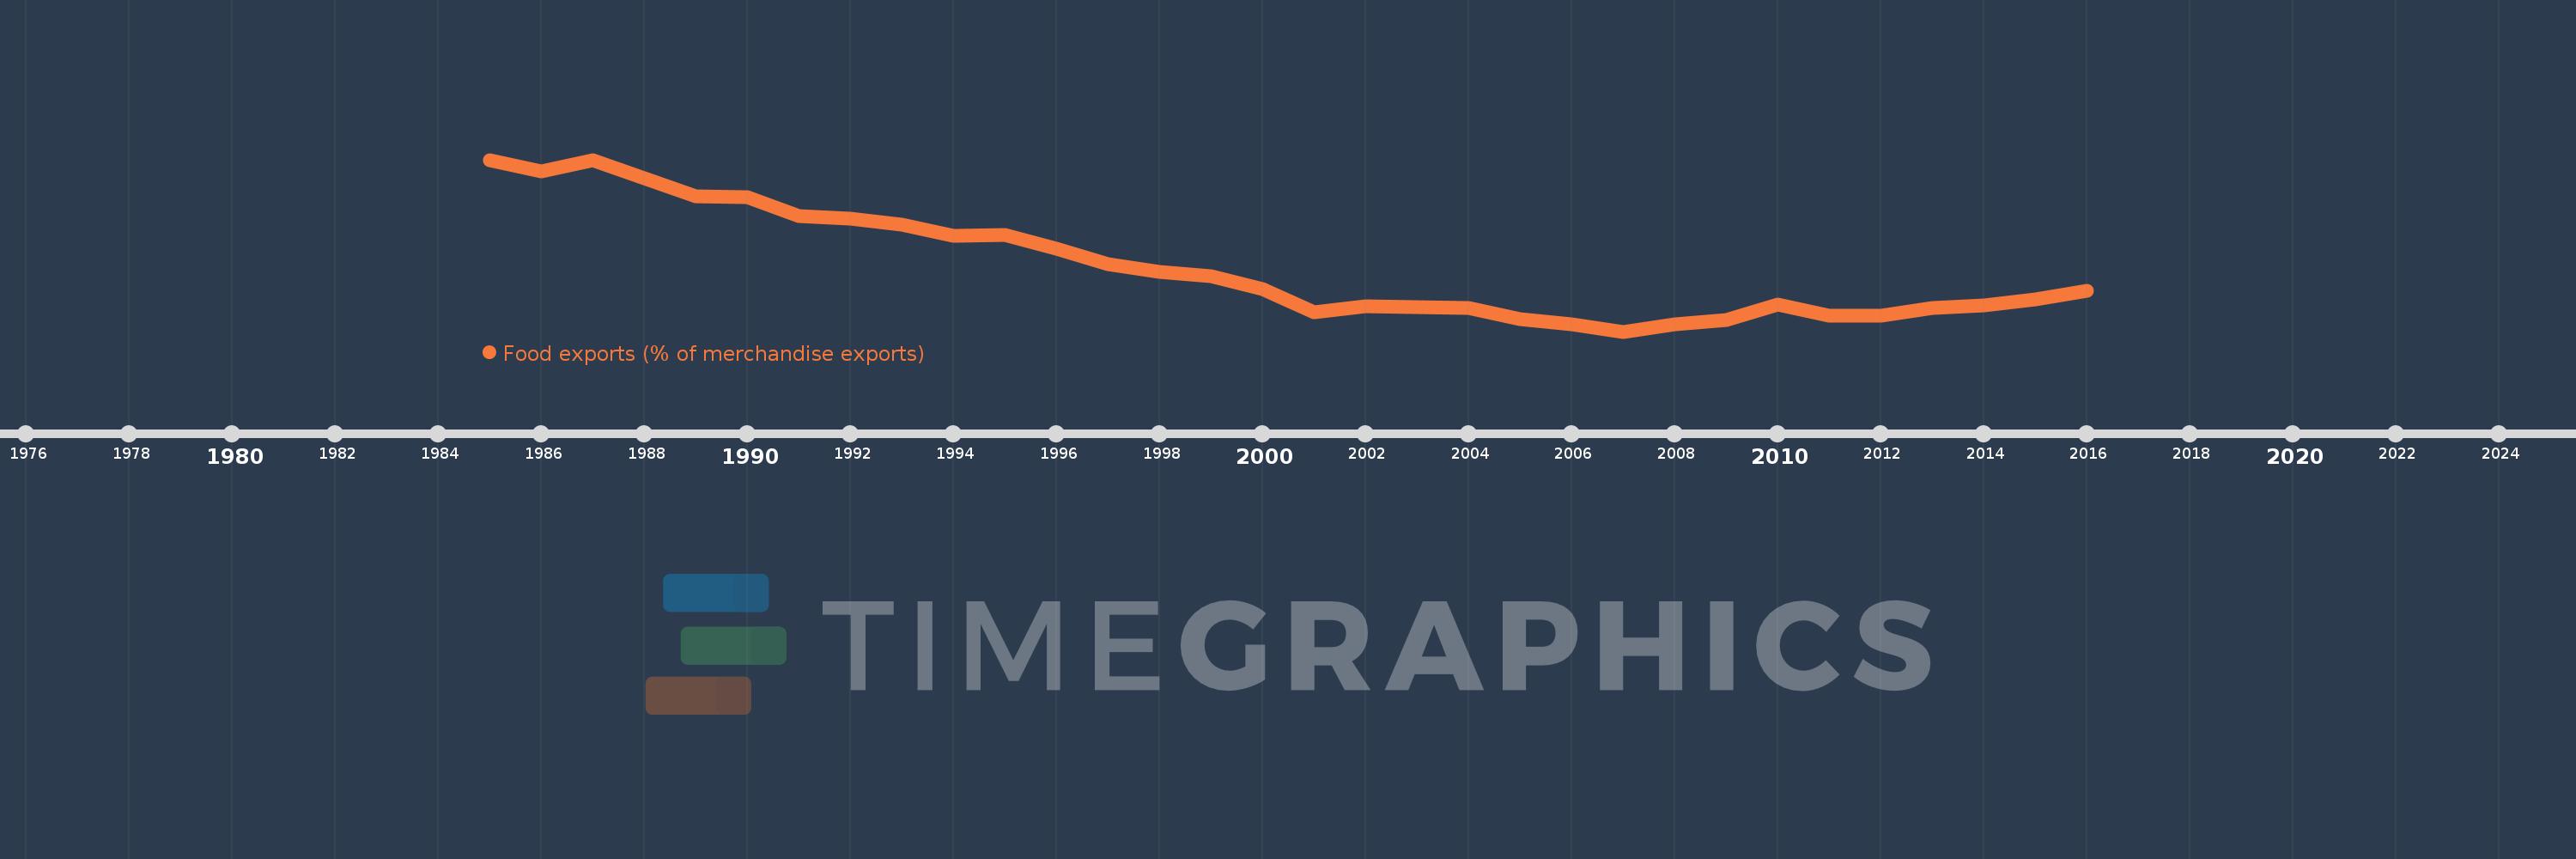
Food exports (% of merchandise exports)
2016,2015,2014,2013,2012,2011,2010,2009,2008,2007,2006,2005,2004,2003,2002,2001,2000,1999,1998,1997,1996,1995,1994,1993,1992,1991,1990,1989,1988,1987,1986,1985
This statistics in other country:
AfghanistanAlbaniaAlgeriaAndorraAngolaAntigua and BarbudaArab WorldArgentinaArmeniaArubaAustraliaAustriaAzerbaijanBahamas, TheBahrainBangladeshBarbadosBelarusBelgiumBelizeBeninBermudaBhutanBoliviaBosnia and HerzegovinaBotswanaBrazilBrunei DarussalamBulgariaBurkina FasoBurundiCabo VerdeCambodiaCameroonCanadaCaribbean small statesCayman IslandsCentral African RepublicCentral Europe and the BalticsChadChileChinaColombiaComorosCongo, Dem. Rep.Congo, Rep.Costa RicaCote d'IvoireCroatiaCubaCyprusCzech RepublicDenmarkDjiboutiDominicaDominican RepublicEarly-demographic dividendEast Asia & PacificEast Asia & Pacific (excluding high income)East Asia & Pacific (IDA & IBRD countries)EcuadorEgypt, Arab Rep.El SalvadorEquatorial GuineaEritreaEstoniaEthiopiaEuro areaEurope & Central AsiaEurope & Central Asia (excluding high income)Europe & Central Asia (IDA & IBRD countries)European UnionFaroe IslandsFijiFinlandFragile and conflict affected situationsFranceFrench PolynesiaGabonGambia, TheGeorgiaGermanyGhanaGreeceGreenlandGrenadaGuatemalaGuineaGuinea-BissauGuyanaHaitiHeavily indebted poor countries (HIPC)High incomeHondurasHong Kong SAR, ChinaHungaryIBRD onlyIcelandIDA & IBRD totalIDA blendIDA onlyIDA totalIndiaIndonesiaIran, Islamic Rep.IraqIrelandIsraelItalyJamaicaJapanJordanKazakhstanKenyaKiribatiKorea, Rep.KuwaitKyrgyz RepublicLao PDRLate-demographic dividendLatin America & Caribbean Latin America & Caribbean (excluding high income)Latin America & the Caribbean (IDA & IBRD countries)LatviaLeast developed countries: UN classificationLebanonLesothoLiberiaLibyaLithuaniaLow & middle incomeLower middle incomeLuxembourgMacao SAR, ChinaMacedonia, FYRMadagascarMalawiMalaysiaMaldivesMaliMaltaMauritaniaMauritiusMexicoMiddle East & North AfricaMiddle East & North Africa (excluding high income)Middle East & North Africa (IDA & IBRD countries)Middle incomeMoldovaMongoliaMoroccoMozambiqueMyanmarNamibiaNepalNetherlandsNew CaledoniaNew ZealandNicaraguaNigerNigeriaNorth AmericaNorwayOECD membersOmanOther small statesPacific island small statesPakistanPalauPanamaPapua New GuineaParaguayPeruPhilippinesPolandPortugalPost-demographic dividendPre-demographic dividendQatarRomaniaRussian FederationRwandaSamoaSao Tome and PrincipeSaudi ArabiaSenegalSerbiaSeychellesSierra LeoneSingaporeSlovak RepublicSloveniaSmall statesSolomon IslandsSomaliaSouth AfricaSouth AsiaSouth Asia (IDA & IBRD)SpainSri LankaSt. Kitts and NevisSt. LuciaSt. Vincent and the GrenadinesSub-Saharan Africa Sub-Saharan Africa (excluding high income)Sub-Saharan Africa (IDA & IBRD countries)SudanSurinameSwazilandSwedenSwitzerlandSyrian Arab RepublicTajikistanTanzaniaThailandTimor-LesteTogoTongaTrinidad and TobagoTunisiaTurkeyTurkmenistanTurks and Caicos IslandsTuvaluUgandaUkraineUnited Arab EmiratesUnited KingdomUnited StatesUpper middle incomeUruguayVanuatuVenezuela, RBVietnamVirgin Islands (U.S.)WorldYemen, Rep.ZambiaZimbabwe Timeline:
This timeline shows a graph from 1985 to 2016 of IDA & IBRD total. No data until 1984. Number of actual observations by date: 32.
Source name:
World Development Indicators
Source organization:
World Bank staff estimates from the Comtrade database maintained by the United Nations Statistics Division.
Categories, topics:
Private Sector, Trade
Last updated:
apr 23, 2017
Indicators value changes by year
Maximum:
20.296
jan 1, 1987
At the date of observation
Value
Absolute change
Change from previous value
jan 1, 1985
20.271
+20.271
0.0%
jan 1, 1986
19.452
-0.819
-4.04%
jan 1, 1987
20.296
+0.843
4.34%
jan 1, 1988
19.021
-1.275
-6.28%
jan 1, 1989
17.74
-1.28
-6.73%
jan 1, 1990
17.635
-0.105
-0.59%
jan 1, 1991
16.316
-1.32
-7.48%
jan 1, 1992
16.177
-0.139
-0.85%
jan 1, 1993
15.699
-0.478
-2.95%
jan 1, 1994
14.934
-0.765
-4.87%
jan 1, 1995
14.976
+0.041
0.28%
jan 1, 1996
14.039
-0.936
-6.25%
jan 1, 1997
12.949
-1.09
-7.77%
jan 1, 1998
12.367
-0.582
-4.49%
jan 1, 1999
12.081
-0.286
-2.31%
jan 1, 2000
11.19
-0.89
-7.37%
jan 1, 2001
9.54
-1.65
-14.75%
jan 1, 2002
9.95
+0.41
4.29%
jan 1, 2003
9.906
-0.044
-0.44%
jan 1, 2004
9.856
-0.05
-0.5%
jan 1, 2005
9.082
-0.774
-7.85%
jan 1, 2006
8.731
-0.351
-3.87%
jan 1, 2007
8.188
-0.543
-6.22%
jan 1, 2008
8.693
+0.505
6.17%
jan 1, 2009
9.028
+0.335
3.86%
jan 1, 2010
10.074
+1.046
11.58%
jan 1, 2011
9.335
-0.739
-7.34%
jan 1, 2012
9.292
-0.042
-0.45%
jan 1, 2013
9.844
+0.552
5.94%
jan 1, 2014
10.024
+0.18
1.82%
jan 1, 2015
10.475
+0.451
4.5%
jan 1, 2016
11.057
+0.583
5.56%
Ranking of countries by current statistics by years


Comments: