29
/
en
AIzaSyAYiBZKx7MnpbEhh9jyipgxe19OcubqV5w
April 1, 2024
250755
St. Lucia
LCA
true
2
1
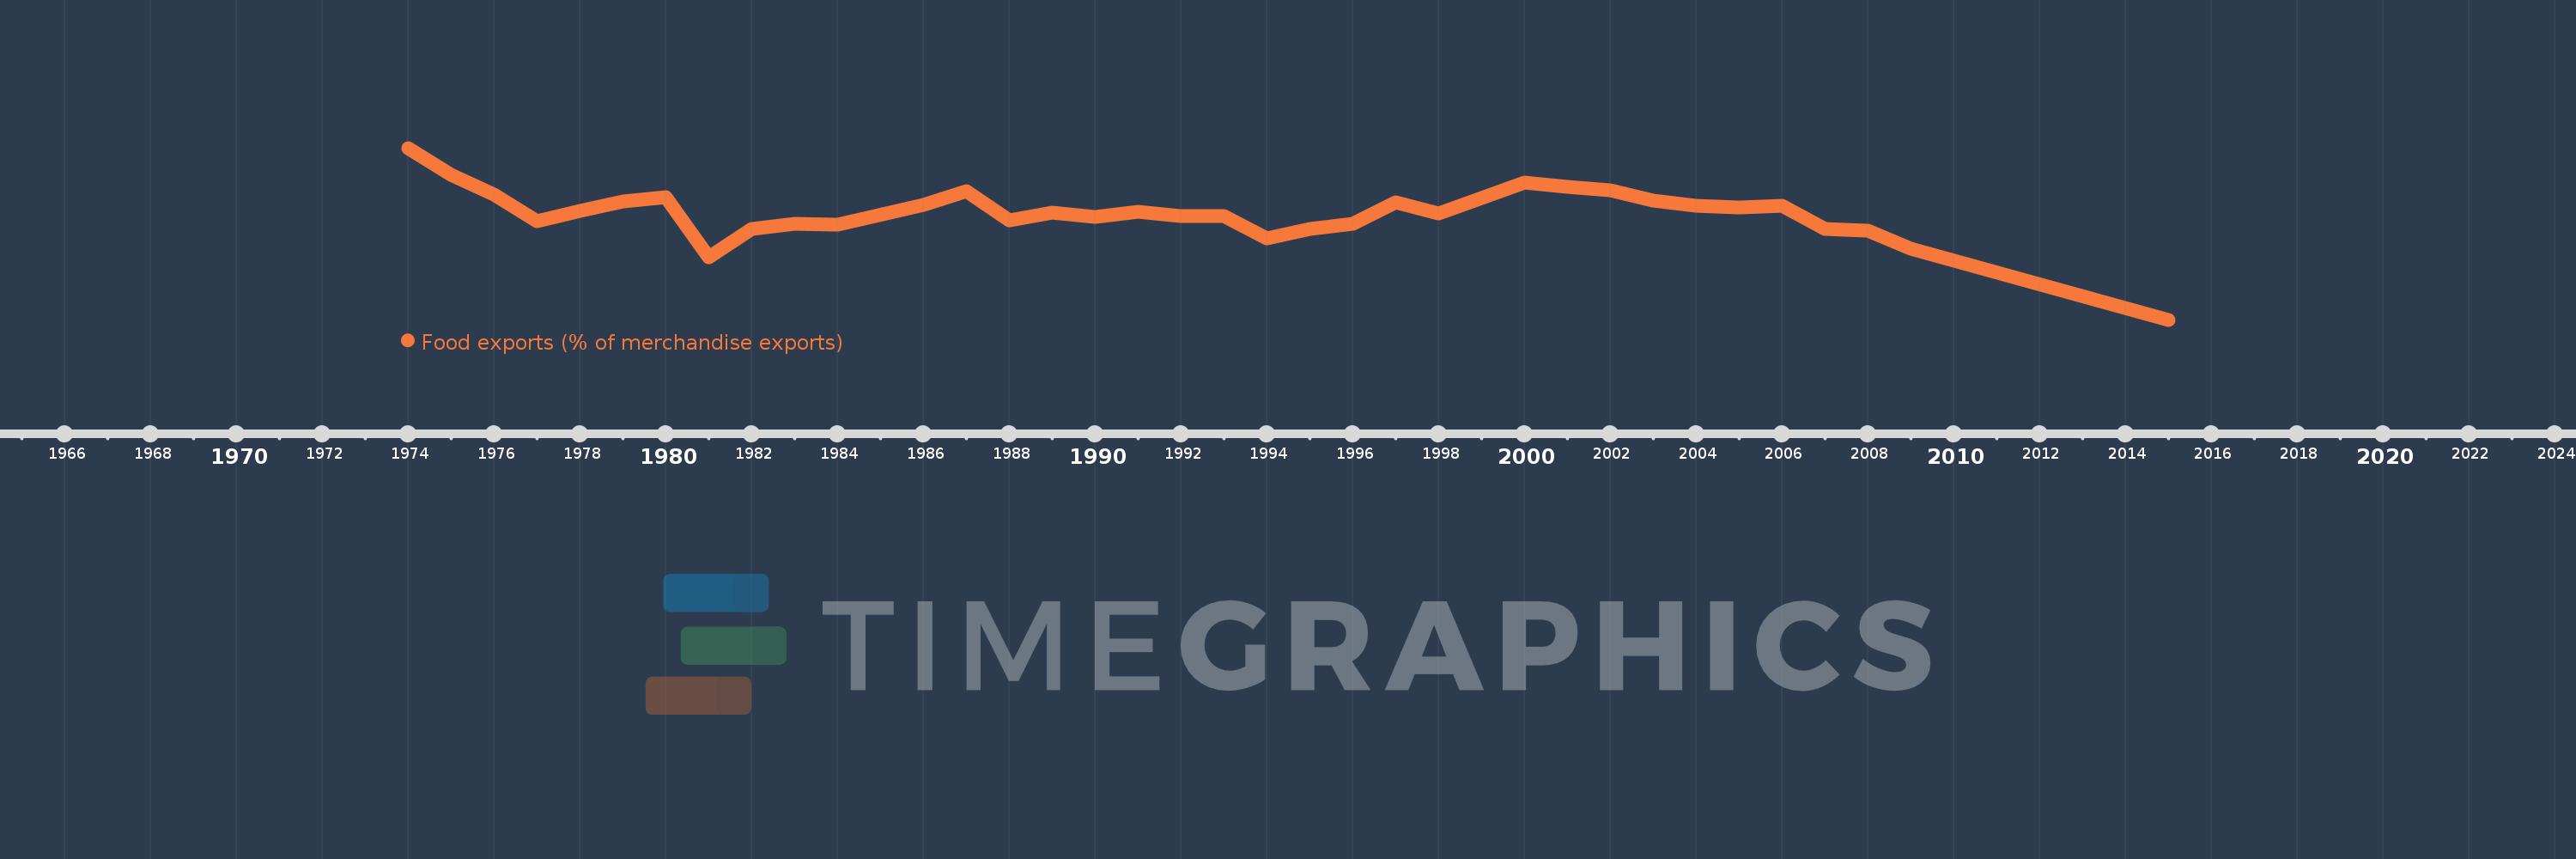
Food exports (% of merchandise exports)
2015,2009,2008,2007,2006,2005,2004,2003,2002,2001,2000,1999,1998,1997,1996,1995,1994,1993,1992,1991,1990,1989,1988,1987,1986,1984,1983,1982,1981,1980,1979,1978,1977,1976,1975,1974
This statistics in other country:
AfghanistanAlbaniaAlgeriaAndorraAngolaAntigua and BarbudaArab WorldArgentinaArmeniaArubaAustraliaAustriaAzerbaijanBahamas, TheBahrainBangladeshBarbadosBelarusBelgiumBelizeBeninBermudaBhutanBoliviaBosnia and HerzegovinaBotswanaBrazilBrunei DarussalamBulgariaBurkina FasoBurundiCabo VerdeCambodiaCameroonCanadaCaribbean small statesCayman IslandsCentral African RepublicCentral Europe and the BalticsChadChileChinaColombiaComorosCongo, Dem. Rep.Congo, Rep.Costa RicaCote d'IvoireCroatiaCubaCyprusCzech RepublicDenmarkDjiboutiDominicaDominican RepublicEarly-demographic dividendEast Asia & PacificEast Asia & Pacific (excluding high income)East Asia & Pacific (IDA & IBRD countries)EcuadorEgypt, Arab Rep.El SalvadorEquatorial GuineaEritreaEstoniaEthiopiaEuro areaEurope & Central AsiaEurope & Central Asia (excluding high income)Europe & Central Asia (IDA & IBRD countries)European UnionFaroe IslandsFijiFinlandFragile and conflict affected situationsFranceFrench PolynesiaGabonGambia, TheGeorgiaGermanyGhanaGreeceGreenlandGrenadaGuatemalaGuineaGuinea-BissauGuyanaHaitiHeavily indebted poor countries (HIPC)High incomeHondurasHong Kong SAR, ChinaHungaryIBRD onlyIcelandIDA & IBRD totalIDA blendIDA onlyIDA totalIndiaIndonesiaIran, Islamic Rep.IraqIrelandIsraelItalyJamaicaJapanJordanKazakhstanKenyaKiribatiKorea, Rep.KuwaitKyrgyz RepublicLao PDRLate-demographic dividendLatin America & Caribbean Latin America & Caribbean (excluding high income)Latin America & the Caribbean (IDA & IBRD countries)LatviaLeast developed countries: UN classificationLebanonLesothoLiberiaLibyaLithuaniaLow & middle incomeLower middle incomeLuxembourgMacao SAR, ChinaMacedonia, FYRMadagascarMalawiMalaysiaMaldivesMaliMaltaMauritaniaMauritiusMexicoMiddle East & North AfricaMiddle East & North Africa (excluding high income)Middle East & North Africa (IDA & IBRD countries)Middle incomeMoldovaMongoliaMoroccoMozambiqueMyanmarNamibiaNepalNetherlandsNew CaledoniaNew ZealandNicaraguaNigerNigeriaNorth AmericaNorwayOECD membersOmanOther small statesPacific island small statesPakistanPalauPanamaPapua New GuineaParaguayPeruPhilippinesPolandPortugalPost-demographic dividendPre-demographic dividendQatarRomaniaRussian FederationRwandaSamoaSao Tome and PrincipeSaudi ArabiaSenegalSerbiaSeychellesSierra LeoneSingaporeSlovak RepublicSloveniaSmall statesSolomon IslandsSomaliaSouth AfricaSouth AsiaSouth Asia (IDA & IBRD)SpainSri LankaSt. Kitts and NevisSt. LuciaSt. Vincent and the GrenadinesSub-Saharan Africa Sub-Saharan Africa (excluding high income)Sub-Saharan Africa (IDA & IBRD countries)SudanSurinameSwazilandSwedenSwitzerlandSyrian Arab RepublicTajikistanTanzaniaThailandTimor-LesteTogoTongaTrinidad and TobagoTunisiaTurkeyTurkmenistanTurks and Caicos IslandsTuvaluUgandaUkraineUnited Arab EmiratesUnited KingdomUnited StatesUpper middle incomeUruguayVanuatuVenezuela, RBVietnamVirgin Islands (U.S.)WorldYemen, Rep.ZambiaZimbabwe Timeline:
This timeline shows a graph from 1974 to 2015 of St. Lucia. No data until 1973. Number of actual observations by date: 36.
Source name:
World Development Indicators
Source organization:
World Bank staff estimates from the Comtrade database maintained by the United Nations Statistics Division.
Categories, topics:
Private Sector, Trade
Last updated:
apr 23, 2017
Indicators value changes by year
Minimum:
37.016
jan 1, 2015
Maximum:
91.979
jan 1, 1974
At the date of observation
Value
Absolute change
Change from previous value
jan 1, 1974
91.979
+91.979
0.0%
jan 1, 1975
83.402
-8.577
-9.32%
jan 1, 1976
76.955
-6.447
-7.73%
jan 1, 1977
68.461
-8.494
-11.04%
jan 1, 1978
71.876
+3.415
4.99%
jan 1, 1979
74.75
+2.874
4.0%
jan 1, 1980
76.236
+1.487
1.99%
jan 1, 1981
56.958
-19.279
-25.29%
jan 1, 1982
66.143
+9.185
16.13%
jan 1, 1983
67.85
+1.707
2.58%
jan 1, 1984
67.308
-0.542
-0.8%
jan 1, 1986
73.664
+6.356
9.44%
jan 1, 1987
78.279
+4.616
6.27%
jan 1, 1988
68.892
-9.387
-11.99%
jan 1, 1989
71.314
+2.422
3.52%
jan 1, 1990
69.859
-1.455
-2.04%
jan 1, 1991
71.591
+1.732
2.48%
jan 1, 1992
70.239
-1.352
-1.89%
jan 1, 1993
70.268
+0.029
0.04%
jan 1, 1994
63.115
-7.153
-10.18%
jan 1, 1995
65.996
+2.881
4.56%
jan 1, 1996
67.806
+1.81
2.74%
jan 1, 1997
74.589
+6.784
10.0%
jan 1, 1998
71.053
-3.536
-4.74%
jan 1, 1999
75.859
+4.806
6.76%
jan 1, 2000
81.012
+5.153
6.79%
jan 1, 2001
79.4
-1.612
-1.99%
jan 1, 2002
78.551
-0.849
-1.07%
jan 1, 2003
75.12
-3.43
-4.37%
jan 1, 2004
73.391
-1.729
-2.3%
jan 1, 2005
73.018
-0.374
-0.51%
jan 1, 2006
73.478
+0.46
0.63%
jan 1, 2007
66.058
-7.42
-10.1%
jan 1, 2008
65.562
-0.496
-0.75%
jan 1, 2009
59.786
-5.777
-8.81%
jan 1, 2015
37.016
-22.77
-38.09%
Ranking of countries by current statistics by years


Comments: