29
/
en
AIzaSyAYiBZKx7MnpbEhh9jyipgxe19OcubqV5w
April 1, 2024
155964
Indonesia
IDN
true
2
1
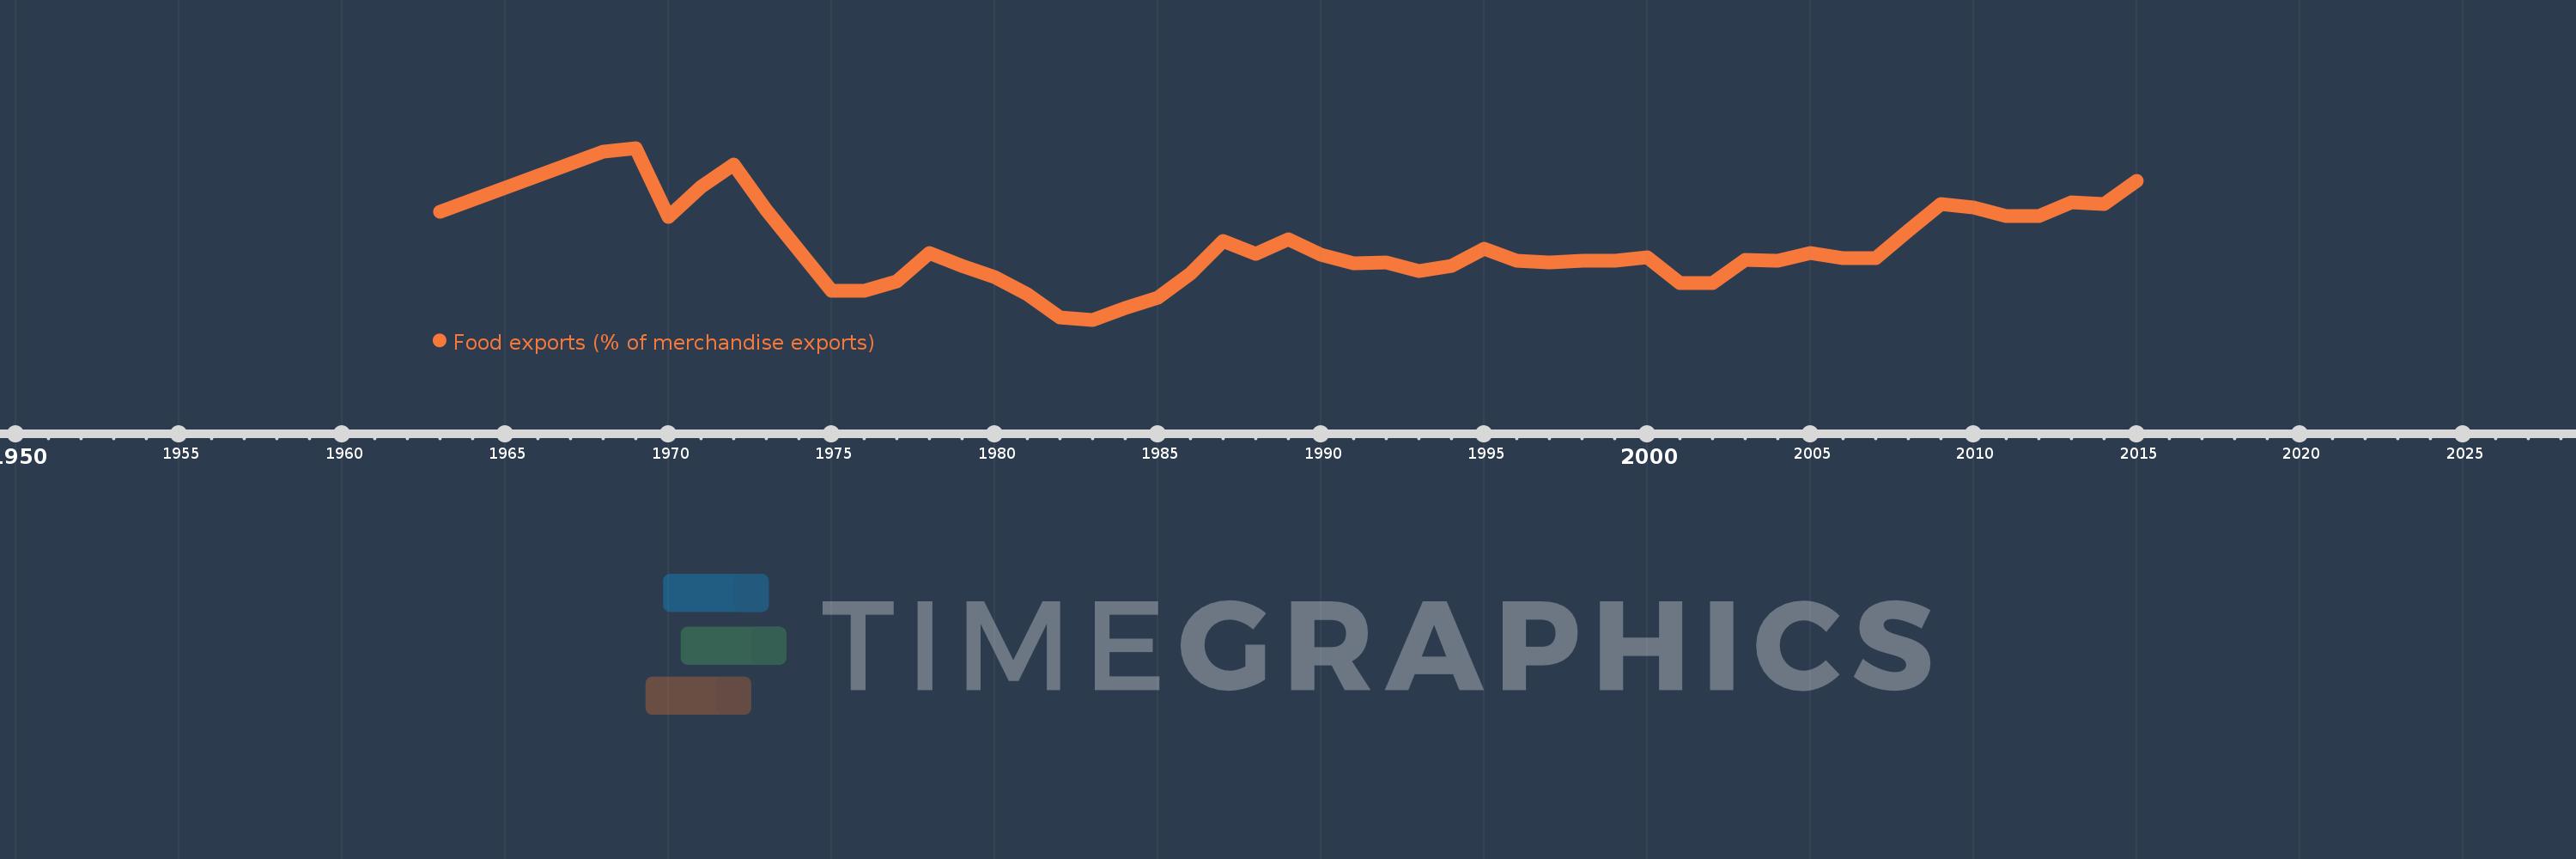
Food exports (% of merchandise exports)
2015,2014,2013,2012,2011,2010,2009,2008,2007,2006,2005,2004,2003,2002,2001,2000,1999,1998,1997,1996,1995,1994,1993,1992,1991,1990,1989,1988,1987,1986,1985,1984,1983,1982,1981,1980,1979,1978,1977,1976,1975,1974,1973,1972,1971,1970,1969,1968,1963
This statistics in other country:
AfghanistanAlbaniaAlgeriaAndorraAngolaAntigua and BarbudaArab WorldArgentinaArmeniaArubaAustraliaAustriaAzerbaijanBahamas, TheBahrainBangladeshBarbadosBelarusBelgiumBelizeBeninBermudaBhutanBoliviaBosnia and HerzegovinaBotswanaBrazilBrunei DarussalamBulgariaBurkina FasoBurundiCabo VerdeCambodiaCameroonCanadaCaribbean small statesCayman IslandsCentral African RepublicCentral Europe and the BalticsChadChileChinaColombiaComorosCongo, Dem. Rep.Congo, Rep.Costa RicaCote d'IvoireCroatiaCubaCyprusCzech RepublicDenmarkDjiboutiDominicaDominican RepublicEarly-demographic dividendEast Asia & PacificEast Asia & Pacific (excluding high income)East Asia & Pacific (IDA & IBRD countries)EcuadorEgypt, Arab Rep.El SalvadorEquatorial GuineaEritreaEstoniaEthiopiaEuro areaEurope & Central AsiaEurope & Central Asia (excluding high income)Europe & Central Asia (IDA & IBRD countries)European UnionFaroe IslandsFijiFinlandFragile and conflict affected situationsFranceFrench PolynesiaGabonGambia, TheGeorgiaGermanyGhanaGreeceGreenlandGrenadaGuatemalaGuineaGuinea-BissauGuyanaHaitiHeavily indebted poor countries (HIPC)High incomeHondurasHong Kong SAR, ChinaHungaryIBRD onlyIcelandIDA & IBRD totalIDA blendIDA onlyIDA totalIndiaIndonesiaIran, Islamic Rep.IraqIrelandIsraelItalyJamaicaJapanJordanKazakhstanKenyaKiribatiKorea, Rep.KuwaitKyrgyz RepublicLao PDRLate-demographic dividendLatin America & Caribbean Latin America & Caribbean (excluding high income)Latin America & the Caribbean (IDA & IBRD countries)LatviaLeast developed countries: UN classificationLebanonLesothoLiberiaLibyaLithuaniaLow & middle incomeLower middle incomeLuxembourgMacao SAR, ChinaMacedonia, FYRMadagascarMalawiMalaysiaMaldivesMaliMaltaMauritaniaMauritiusMexicoMiddle East & North AfricaMiddle East & North Africa (excluding high income)Middle East & North Africa (IDA & IBRD countries)Middle incomeMoldovaMongoliaMoroccoMozambiqueMyanmarNamibiaNepalNetherlandsNew CaledoniaNew ZealandNicaraguaNigerNigeriaNorth AmericaNorwayOECD membersOmanOther small statesPacific island small statesPakistanPalauPanamaPapua New GuineaParaguayPeruPhilippinesPolandPortugalPost-demographic dividendPre-demographic dividendQatarRomaniaRussian FederationRwandaSamoaSao Tome and PrincipeSaudi ArabiaSenegalSerbiaSeychellesSierra LeoneSingaporeSlovak RepublicSloveniaSmall statesSolomon IslandsSomaliaSouth AfricaSouth AsiaSouth Asia (IDA & IBRD)SpainSri LankaSt. Kitts and NevisSt. LuciaSt. Vincent and the GrenadinesSub-Saharan Africa Sub-Saharan Africa (excluding high income)Sub-Saharan Africa (IDA & IBRD countries)SudanSurinameSwazilandSwedenSwitzerlandSyrian Arab RepublicTajikistanTanzaniaThailandTimor-LesteTogoTongaTrinidad and TobagoTunisiaTurkeyTurkmenistanTurks and Caicos IslandsTuvaluUgandaUkraineUnited Arab EmiratesUnited KingdomUnited StatesUpper middle incomeUruguayVanuatuVenezuela, RBVietnamVirgin Islands (U.S.)WorldYemen, Rep.ZambiaZimbabwe Timeline:
This timeline shows a graph from 1963 to 2015 of Indonesia. No data until 1962. Number of actual observations by date: 49.
Source name:
World Development Indicators
Source organization:
World Bank staff estimates from the Comtrade database maintained by the United Nations Statistics Division.
Categories, topics:
Private Sector, Trade
Last updated:
apr 23, 2017
Indicators value changes by year
Maximum:
23.924
jan 1, 1969
At the date of observation
Value
Absolute change
Change from previous value
jan 1, 1963
16.825
+16.825
0.0%
jan 1, 1968
23.519
+6.694
39.78%
jan 1, 1969
23.924
+0.404
1.72%
jan 1, 1970
16.269
-7.655
-32.0%
jan 1, 1971
19.561
+3.292
20.23%
jan 1, 1972
22.128
+2.567
13.12%
jan 1, 1973
16.998
-5.13
-23.18%
jan 1, 1974
12.584
-4.413
-25.96%
jan 1, 1975
8.056
-4.528
-35.98%
jan 1, 1976
8.058
+0.002
0.02%
jan 1, 1977
9.12
+1.062
13.18%
jan 1, 1978
12.234
+3.114
34.14%
jan 1, 1979
10.847
-1.387
-11.34%
jan 1, 1980
9.603
-1.243
-11.46%
jan 1, 1981
7.648
-1.955
-20.36%
jan 1, 1982
5.076
-2.572
-33.63%
jan 1, 1983
4.862
-0.214
-4.22%
jan 1, 1984
6.165
+1.303
26.79%
jan 1, 1985
7.274
+1.109
17.99%
jan 1, 1986
9.964
+2.69
36.98%
jan 1, 1987
13.589
+3.626
36.39%
jan 1, 1988
12.184
-1.406
-10.34%
jan 1, 1989
13.822
+1.638
13.45%
jan 1, 1990
12.033
-1.789
-12.95%
jan 1, 1991
11.158
-0.875
-7.27%
jan 1, 1992
11.26
+0.103
0.92%
jan 1, 1993
10.233
-1.028
-9.13%
jan 1, 1994
10.833
+0.6
5.87%
jan 1, 1995
12.744
+1.911
17.64%
jan 1, 1996
11.393
-1.352
-10.6%
jan 1, 1997
11.196
-0.197
-1.73%
jan 1, 1998
11.417
+0.222
1.98%
jan 1, 1999
11.403
-0.014
-0.12%
jan 1, 2000
11.829
+0.426
3.73%
jan 1, 2001
8.946
-2.883
-24.37%
jan 1, 2002
8.946
+0.0
0.0%
jan 1, 2003
11.509
+2.563
28.64%
jan 1, 2004
11.379
-0.13
-1.13%
jan 1, 2005
12.292
+0.913
8.02%
jan 1, 2006
11.684
-0.607
-4.94%
jan 1, 2007
11.682
-0.002
-0.02%
jan 1, 2008
14.707
+3.025
25.89%
jan 1, 2009
17.686
+2.979
20.26%
jan 1, 2010
17.3
-0.386
-2.18%
jan 1, 2011
16.364
-0.936
-5.41%
jan 1, 2012
16.327
-0.037
-0.23%
jan 1, 2013
17.917
+1.59
9.74%
jan 1, 2014
17.67
-0.247
-1.38%
jan 1, 2015
20.278
+2.608
14.76%
Ranking of countries by current statistics by years


Comments: