29
/
en
AIzaSyAYiBZKx7MnpbEhh9jyipgxe19OcubqV5w
April 1, 2024
187767
Malaysia
MYS
true
2
1
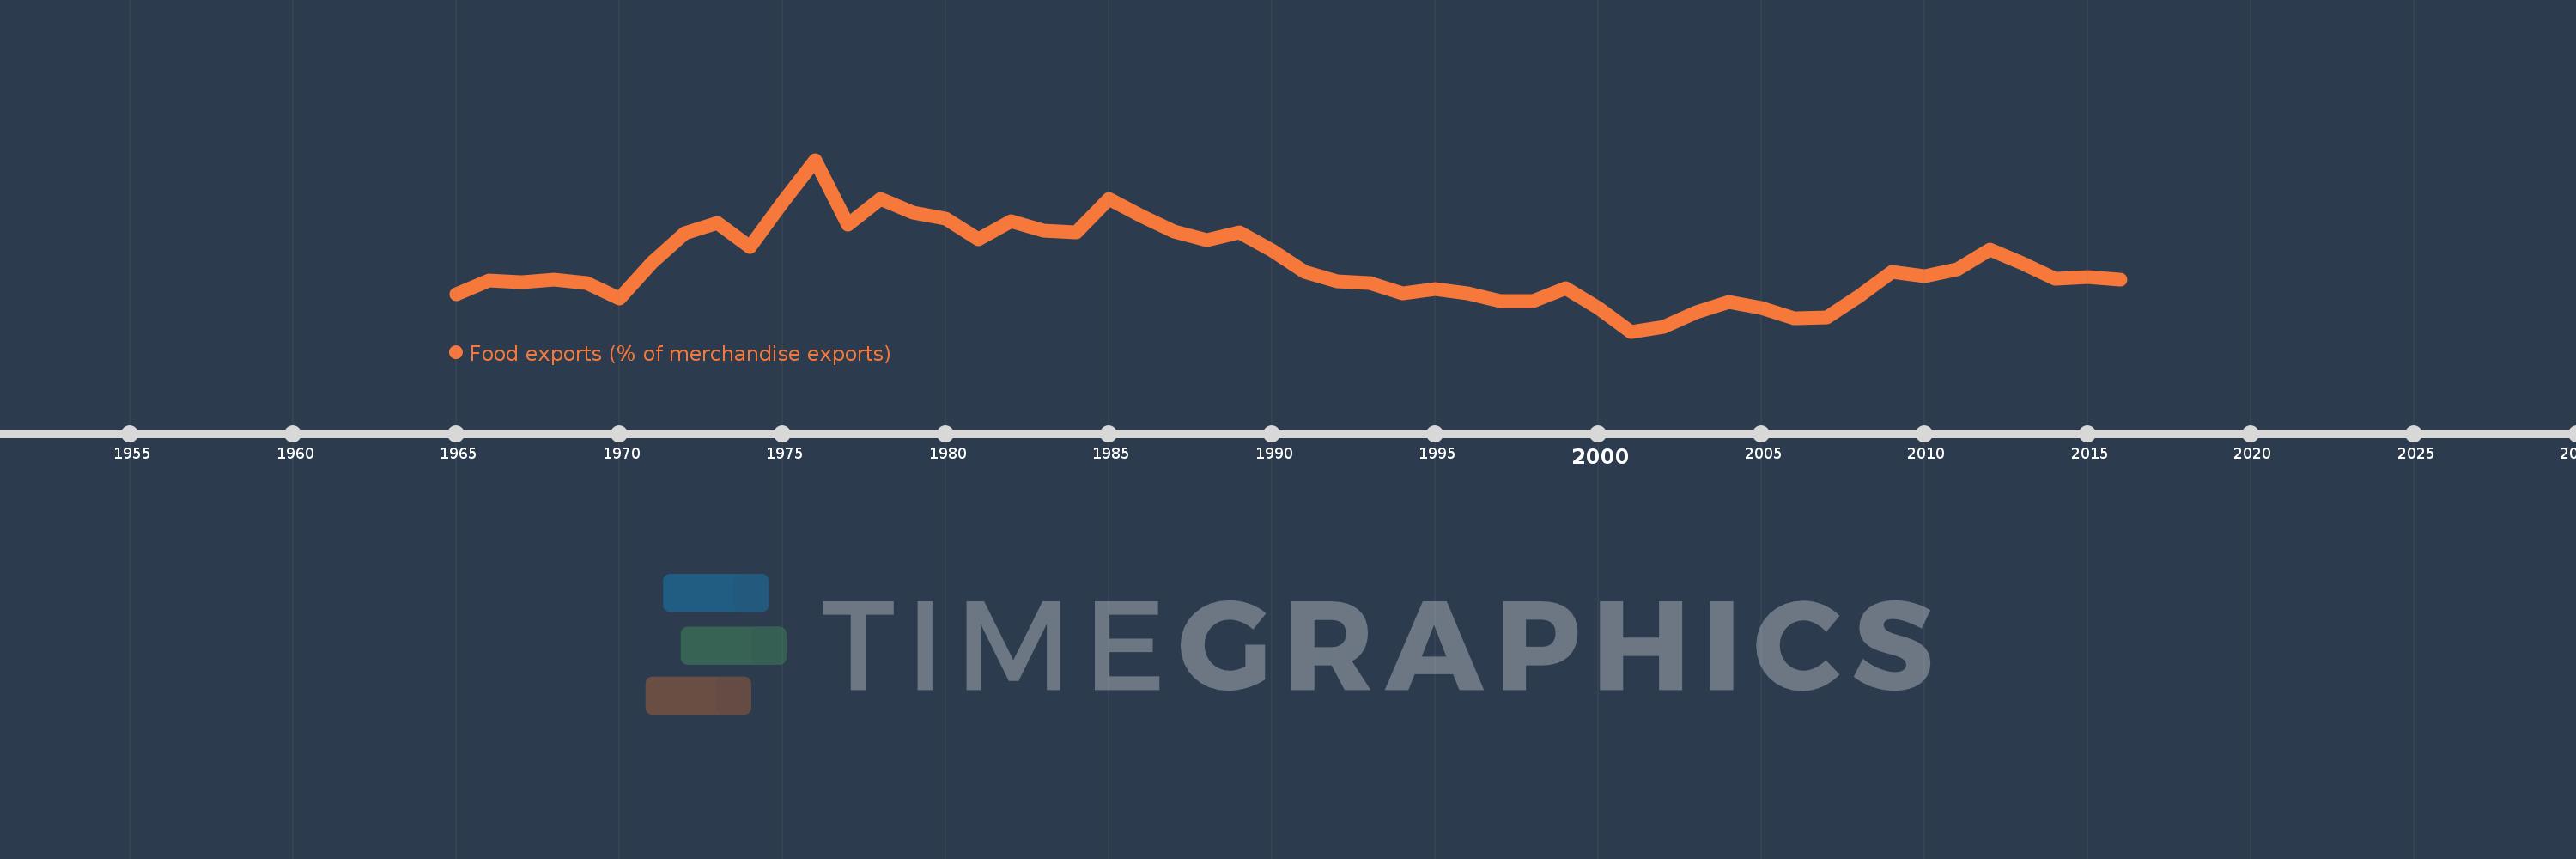
Food exports (% of merchandise exports)
2016,2015,2014,2013,2012,2011,2010,2009,2008,2007,2006,2005,2004,2003,2002,2001,2000,1999,1998,1997,1996,1995,1994,1993,1992,1991,1990,1989,1988,1987,1986,1985,1984,1983,1982,1981,1980,1979,1978,1977,1976,1975,1974,1973,1972,1971,1970,1969,1968,1967,1966,1965
This statistics in other country:
AfghanistanAlbaniaAlgeriaAndorraAngolaAntigua and BarbudaArab WorldArgentinaArmeniaArubaAustraliaAustriaAzerbaijanBahamas, TheBahrainBangladeshBarbadosBelarusBelgiumBelizeBeninBermudaBhutanBoliviaBosnia and HerzegovinaBotswanaBrazilBrunei DarussalamBulgariaBurkina FasoBurundiCabo VerdeCambodiaCameroonCanadaCaribbean small statesCayman IslandsCentral African RepublicCentral Europe and the BalticsChadChileChinaColombiaComorosCongo, Dem. Rep.Congo, Rep.Costa RicaCote d'IvoireCroatiaCubaCyprusCzech RepublicDenmarkDjiboutiDominicaDominican RepublicEarly-demographic dividendEast Asia & PacificEast Asia & Pacific (excluding high income)East Asia & Pacific (IDA & IBRD countries)EcuadorEgypt, Arab Rep.El SalvadorEquatorial GuineaEritreaEstoniaEthiopiaEuro areaEurope & Central AsiaEurope & Central Asia (excluding high income)Europe & Central Asia (IDA & IBRD countries)European UnionFaroe IslandsFijiFinlandFragile and conflict affected situationsFranceFrench PolynesiaGabonGambia, TheGeorgiaGermanyGhanaGreeceGreenlandGrenadaGuatemalaGuineaGuinea-BissauGuyanaHaitiHeavily indebted poor countries (HIPC)High incomeHondurasHong Kong SAR, ChinaHungaryIBRD onlyIcelandIDA & IBRD totalIDA blendIDA onlyIDA totalIndiaIndonesiaIran, Islamic Rep.IraqIrelandIsraelItalyJamaicaJapanJordanKazakhstanKenyaKiribatiKorea, Rep.KuwaitKyrgyz RepublicLao PDRLate-demographic dividendLatin America & Caribbean Latin America & Caribbean (excluding high income)Latin America & the Caribbean (IDA & IBRD countries)LatviaLeast developed countries: UN classificationLebanonLesothoLiberiaLibyaLithuaniaLow & middle incomeLower middle incomeLuxembourgMacao SAR, ChinaMacedonia, FYRMadagascarMalawiMalaysiaMaldivesMaliMaltaMauritaniaMauritiusMexicoMiddle East & North AfricaMiddle East & North Africa (excluding high income)Middle East & North Africa (IDA & IBRD countries)Middle incomeMoldovaMongoliaMoroccoMozambiqueMyanmarNamibiaNepalNetherlandsNew CaledoniaNew ZealandNicaraguaNigerNigeriaNorth AmericaNorwayOECD membersOmanOther small statesPacific island small statesPakistanPalauPanamaPapua New GuineaParaguayPeruPhilippinesPolandPortugalPost-demographic dividendPre-demographic dividendQatarRomaniaRussian FederationRwandaSamoaSao Tome and PrincipeSaudi ArabiaSenegalSerbiaSeychellesSierra LeoneSingaporeSlovak RepublicSloveniaSmall statesSolomon IslandsSomaliaSouth AfricaSouth AsiaSouth Asia (IDA & IBRD)SpainSri LankaSt. Kitts and NevisSt. LuciaSt. Vincent and the GrenadinesSub-Saharan Africa Sub-Saharan Africa (excluding high income)Sub-Saharan Africa (IDA & IBRD countries)SudanSurinameSwazilandSwedenSwitzerlandSyrian Arab RepublicTajikistanTanzaniaThailandTimor-LesteTogoTongaTrinidad and TobagoTunisiaTurkeyTurkmenistanTurks and Caicos IslandsTuvaluUgandaUkraineUnited Arab EmiratesUnited KingdomUnited StatesUpper middle incomeUruguayVanuatuVenezuela, RBVietnamVirgin Islands (U.S.)WorldYemen, Rep.ZambiaZimbabwe Timeline:
This timeline shows a graph from 1965 to 2016 of Malaysia. No data until 1964. Number of actual observations by date: 52.
Source name:
World Development Indicators
Source organization:
World Bank staff estimates from the Comtrade database maintained by the United Nations Statistics Division.
Categories, topics:
Private Sector, Trade
Last updated:
apr 23, 2017
Indicators value changes by year
Maximum:
23.213
jan 1, 1976
At the date of observation
Value
Absolute change
Change from previous value
jan 1, 1965
9.418
+9.418
0.0%
jan 1, 1966
10.765
+1.347
14.3%
jan 1, 1967
10.58
-0.185
-1.72%
jan 1, 1968
10.873
+0.293
2.77%
jan 1, 1969
10.526
-0.346
-3.18%
jan 1, 1970
8.965
-1.561
-14.83%
jan 1, 1971
12.636
+3.67
40.94%
jan 1, 1972
15.642
+3.006
23.79%
jan 1, 1973
16.748
+1.106
7.07%
jan 1, 1974
14.234
-2.515
-15.01%
jan 1, 1975
18.839
+4.606
32.36%
jan 1, 1976
23.213
+4.374
23.22%
jan 1, 1977
16.534
-6.679
-28.77%
jan 1, 1978
19.195
+2.66
16.09%
jan 1, 1979
17.802
-1.393
-7.26%
jan 1, 1980
17.155
-0.647
-3.63%
jan 1, 1981
15.046
-2.109
-12.29%
jan 1, 1982
16.869
+1.822
12.11%
jan 1, 1983
15.943
-0.925
-5.48%
jan 1, 1984
15.73
-0.213
-1.34%
jan 1, 1985
19.213
+3.483
22.14%
jan 1, 1986
17.45
-1.763
-9.18%
jan 1, 1987
15.831
-1.619
-9.28%
jan 1, 1988
14.909
-0.921
-5.82%
jan 1, 1989
15.784
+0.874
5.86%
jan 1, 1990
13.913
-1.871
-11.85%
jan 1, 1991
11.657
-2.256
-16.21%
jan 1, 1992
10.677
-0.98
-8.41%
jan 1, 1993
10.49
-0.187
-1.75%
jan 1, 1994
9.435
-1.054
-10.05%
jan 1, 1995
9.882
+0.446
4.73%
jan 1, 1996
9.503
-0.379
-3.84%
jan 1, 1997
8.707
-0.796
-8.37%
jan 1, 1998
8.657
-0.05
-0.57%
jan 1, 1999
9.977
+1.32
15.25%
jan 1, 2000
7.99
-1.987
-19.92%
jan 1, 2001
5.54
-2.45
-30.66%
jan 1, 2002
6.059
+0.518
9.35%
jan 1, 2003
7.488
+1.429
23.59%
jan 1, 2004
8.607
+1.119
14.94%
jan 1, 2005
7.961
-0.646
-7.5%
jan 1, 2006
6.95
-1.011
-12.7%
jan 1, 2007
6.979
+0.029
0.41%
jan 1, 2008
9.237
+2.259
32.37%
jan 1, 2009
11.685
+2.447
26.5%
jan 1, 2010
11.259
-0.426
-3.65%
jan 1, 2011
11.904
+0.646
5.74%
jan 1, 2012
13.997
+2.092
17.58%
jan 1, 2013
12.541
-1.456
-10.4%
jan 1, 2014
11.008
-1.533
-12.23%
jan 1, 2015
11.126
+0.119
1.08%
jan 1, 2016
10.851
-0.275
-2.47%
Ranking of countries by current statistics by years


Comments: