29
/
en
AIzaSyAYiBZKx7MnpbEhh9jyipgxe19OcubqV5w
April 1, 2024
159386
Ireland
IRL
true
2
1
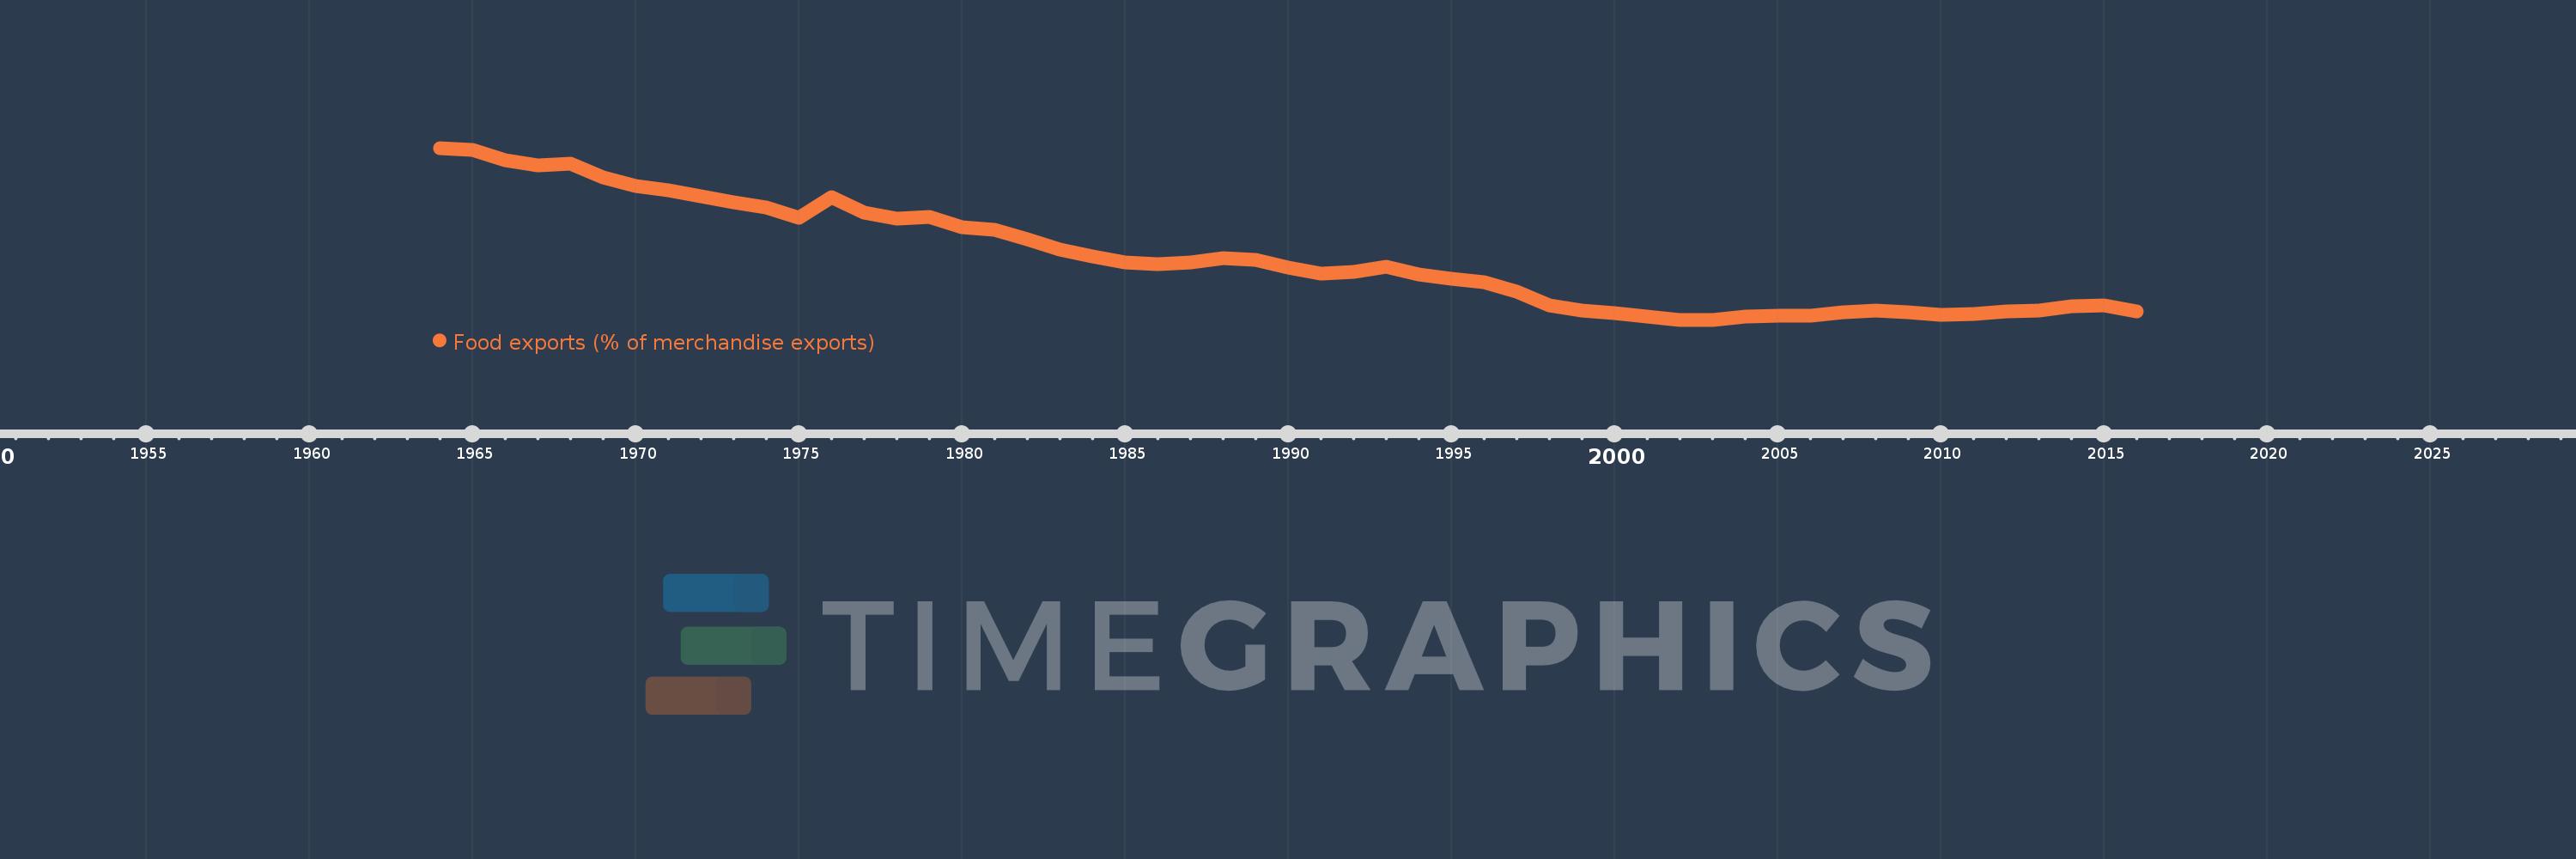
Food exports (% of merchandise exports)
2016,2015,2014,2013,2012,2011,2010,2009,2008,2007,2006,2005,2004,2003,2002,2001,2000,1999,1998,1997,1996,1995,1994,1993,1992,1991,1990,1989,1988,1987,1986,1985,1984,1983,1982,1981,1980,1979,1978,1977,1976,1975,1974,1973,1972,1971,1970,1969,1968,1967,1966,1965,1964
This statistics in other country:
AfghanistanAlbaniaAlgeriaAndorraAngolaAntigua and BarbudaArab WorldArgentinaArmeniaArubaAustraliaAustriaAzerbaijanBahamas, TheBahrainBangladeshBarbadosBelarusBelgiumBelizeBeninBermudaBhutanBoliviaBosnia and HerzegovinaBotswanaBrazilBrunei DarussalamBulgariaBurkina FasoBurundiCabo VerdeCambodiaCameroonCanadaCaribbean small statesCayman IslandsCentral African RepublicCentral Europe and the BalticsChadChileChinaColombiaComorosCongo, Dem. Rep.Congo, Rep.Costa RicaCote d'IvoireCroatiaCubaCyprusCzech RepublicDenmarkDjiboutiDominicaDominican RepublicEarly-demographic dividendEast Asia & PacificEast Asia & Pacific (excluding high income)East Asia & Pacific (IDA & IBRD countries)EcuadorEgypt, Arab Rep.El SalvadorEquatorial GuineaEritreaEstoniaEthiopiaEuro areaEurope & Central AsiaEurope & Central Asia (excluding high income)Europe & Central Asia (IDA & IBRD countries)European UnionFaroe IslandsFijiFinlandFragile and conflict affected situationsFranceFrench PolynesiaGabonGambia, TheGeorgiaGermanyGhanaGreeceGreenlandGrenadaGuatemalaGuineaGuinea-BissauGuyanaHaitiHeavily indebted poor countries (HIPC)High incomeHondurasHong Kong SAR, ChinaHungaryIBRD onlyIcelandIDA & IBRD totalIDA blendIDA onlyIDA totalIndiaIndonesiaIran, Islamic Rep.IraqIrelandIsraelItalyJamaicaJapanJordanKazakhstanKenyaKiribatiKorea, Rep.KuwaitKyrgyz RepublicLao PDRLate-demographic dividendLatin America & Caribbean Latin America & Caribbean (excluding high income)Latin America & the Caribbean (IDA & IBRD countries)LatviaLeast developed countries: UN classificationLebanonLesothoLiberiaLibyaLithuaniaLow & middle incomeLower middle incomeLuxembourgMacao SAR, ChinaMacedonia, FYRMadagascarMalawiMalaysiaMaldivesMaliMaltaMauritaniaMauritiusMexicoMiddle East & North AfricaMiddle East & North Africa (excluding high income)Middle East & North Africa (IDA & IBRD countries)Middle incomeMoldovaMongoliaMoroccoMozambiqueMyanmarNamibiaNepalNetherlandsNew CaledoniaNew ZealandNicaraguaNigerNigeriaNorth AmericaNorwayOECD membersOmanOther small statesPacific island small statesPakistanPalauPanamaPapua New GuineaParaguayPeruPhilippinesPolandPortugalPost-demographic dividendPre-demographic dividendQatarRomaniaRussian FederationRwandaSamoaSao Tome and PrincipeSaudi ArabiaSenegalSerbiaSeychellesSierra LeoneSingaporeSlovak RepublicSloveniaSmall statesSolomon IslandsSomaliaSouth AfricaSouth AsiaSouth Asia (IDA & IBRD)SpainSri LankaSt. Kitts and NevisSt. LuciaSt. Vincent and the GrenadinesSub-Saharan Africa Sub-Saharan Africa (excluding high income)Sub-Saharan Africa (IDA & IBRD countries)SudanSurinameSwazilandSwedenSwitzerlandSyrian Arab RepublicTajikistanTanzaniaThailandTimor-LesteTogoTongaTrinidad and TobagoTunisiaTurkeyTurkmenistanTurks and Caicos IslandsTuvaluUgandaUkraineUnited Arab EmiratesUnited KingdomUnited StatesUpper middle incomeUruguayVanuatuVenezuela, RBVietnamVirgin Islands (U.S.)WorldYemen, Rep.ZambiaZimbabwe Timeline:
This timeline shows a graph from 1964 to 2016 of Ireland. No data until 1963. Number of actual observations by date: 53.
Source name:
World Development Indicators
Source organization:
World Bank staff estimates from the Comtrade database maintained by the United Nations Statistics Division.
Categories, topics:
Private Sector, Trade
Last updated:
apr 23, 2017
Indicators value changes by year
Maximum:
63.088
jan 1, 1964
At the date of observation
Value
Absolute change
Change from previous value
jan 1, 1964
63.088
+63.088
0.0%
jan 1, 1965
62.317
-0.771
-1.22%
jan 1, 1966
59.115
-3.202
-5.14%
jan 1, 1967
57.354
-1.76
-2.98%
jan 1, 1968
57.986
+0.631
1.1%
jan 1, 1969
53.507
-4.478
-7.72%
jan 1, 1970
50.608
-2.899
-5.42%
jan 1, 1971
49.367
-1.241
-2.45%
jan 1, 1972
47.376
-1.991
-4.03%
jan 1, 1973
45.286
-2.091
-4.41%
jan 1, 1974
43.627
-1.659
-3.66%
jan 1, 1975
40.372
-3.255
-7.46%
jan 1, 1976
47.199
+6.827
16.91%
jan 1, 1977
42.046
-5.153
-10.92%
jan 1, 1978
40.118
-1.928
-4.59%
jan 1, 1979
40.678
+0.56
1.4%
jan 1, 1980
37.332
-3.346
-8.23%
jan 1, 1981
36.599
-0.733
-1.96%
jan 1, 1982
33.282
-3.317
-9.06%
jan 1, 1983
30.116
-3.166
-9.51%
jan 1, 1984
27.929
-2.187
-7.26%
jan 1, 1985
25.735
-2.194
-7.85%
jan 1, 1986
25.282
-0.453
-1.76%
jan 1, 1987
25.94
+0.658
2.6%
jan 1, 1988
27.291
+1.351
5.21%
jan 1, 1989
26.648
-0.643
-2.36%
jan 1, 1990
24.111
-2.537
-9.52%
jan 1, 1991
22.317
-1.794
-7.44%
jan 1, 1992
22.655
+0.338
1.52%
jan 1, 1993
24.409
+1.754
7.74%
jan 1, 1994
21.903
-2.506
-10.27%
jan 1, 1995
20.568
-1.335
-6.09%
jan 1, 1996
19.393
-1.175
-5.71%
jan 1, 1997
16.45
-2.943
-15.17%
jan 1, 1998
11.871
-4.579
-27.84%
jan 1, 1999
10.147
-1.725
-14.53%
jan 1, 2000
9.436
-0.711
-7.0%
jan 1, 2001
8.293
-1.143
-12.11%
jan 1, 2002
7.252
-1.041
-12.55%
jan 1, 2003
7.219
-0.033
-0.46%
jan 1, 2004
8.344
+1.125
15.58%
jan 1, 2005
8.397
+0.054
0.64%
jan 1, 2006
8.439
+0.041
0.49%
jan 1, 2007
9.701
+1.262
14.95%
jan 1, 2008
10.141
+0.44
4.53%
jan 1, 2009
9.684
-0.457
-4.51%
jan 1, 2010
8.757
-0.927
-9.57%
jan 1, 2011
9.196
+0.439
5.02%
jan 1, 2012
9.995
+0.799
8.68%
jan 1, 2013
10.258
+0.263
2.63%
jan 1, 2014
11.489
+1.232
12.01%
jan 1, 2015
11.821
+0.332
2.89%
jan 1, 2016
9.996
-1.825
-15.44%
Ranking of countries by current statistics by years


Comments: