29
/
en
AIzaSyAYiBZKx7MnpbEhh9jyipgxe19OcubqV5w
April 1, 2024
280950
Venezuela, RB
VEN
true
2
1
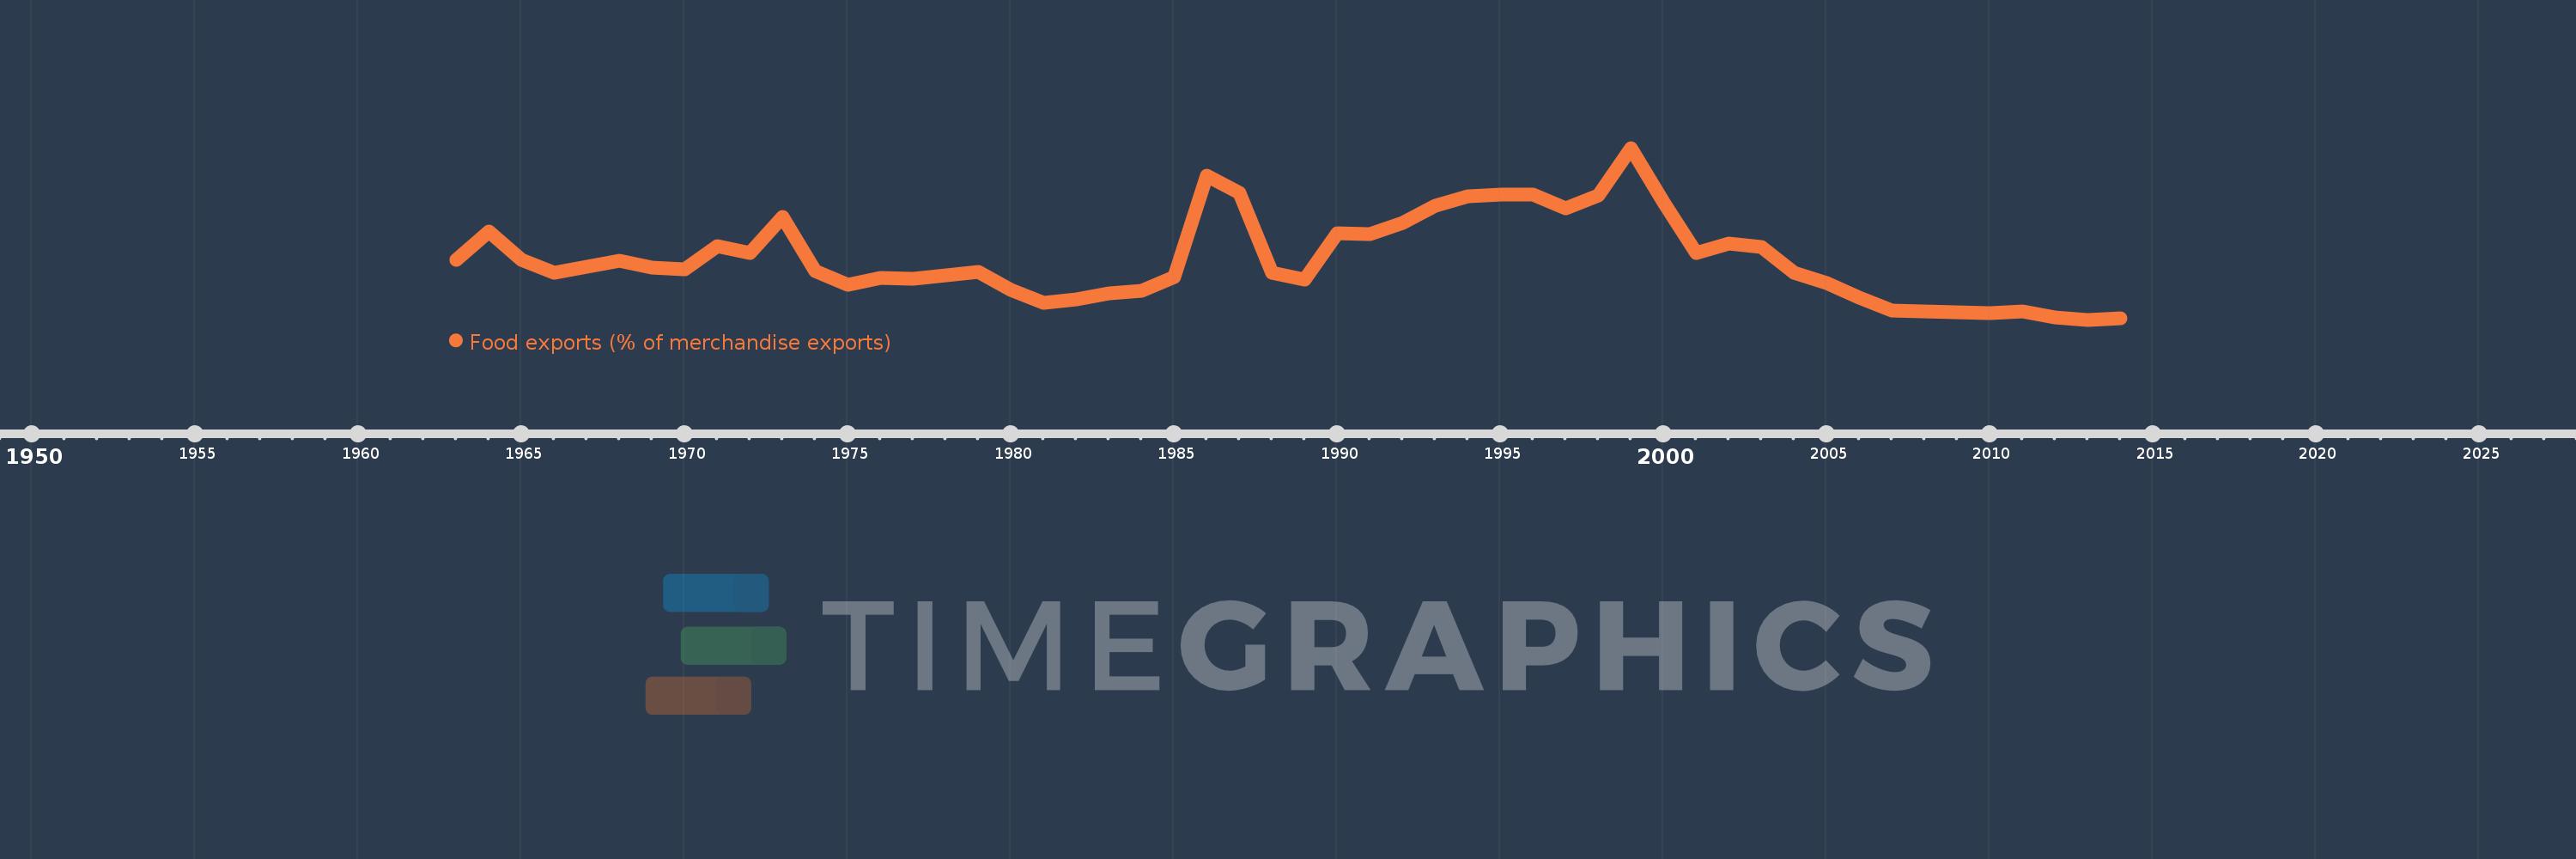
Food exports (% of merchandise exports)
2014,2013,2012,2011,2010,2009,2007,2006,2005,2004,2003,2002,2001,2000,1999,1998,1997,1996,1995,1994,1993,1992,1991,1990,1989,1988,1987,1986,1985,1984,1983,1982,1981,1980,1979,1978,1977,1976,1975,1974,1973,1972,1971,1970,1969,1968,1967,1966,1965,1964,1963
This statistics in other country:
AfghanistanAlbaniaAlgeriaAndorraAngolaAntigua and BarbudaArab WorldArgentinaArmeniaArubaAustraliaAustriaAzerbaijanBahamas, TheBahrainBangladeshBarbadosBelarusBelgiumBelizeBeninBermudaBhutanBoliviaBosnia and HerzegovinaBotswanaBrazilBrunei DarussalamBulgariaBurkina FasoBurundiCabo VerdeCambodiaCameroonCanadaCaribbean small statesCayman IslandsCentral African RepublicCentral Europe and the BalticsChadChileChinaColombiaComorosCongo, Dem. Rep.Congo, Rep.Costa RicaCote d'IvoireCroatiaCubaCyprusCzech RepublicDenmarkDjiboutiDominicaDominican RepublicEarly-demographic dividendEast Asia & PacificEast Asia & Pacific (excluding high income)East Asia & Pacific (IDA & IBRD countries)EcuadorEgypt, Arab Rep.El SalvadorEquatorial GuineaEritreaEstoniaEthiopiaEuro areaEurope & Central AsiaEurope & Central Asia (excluding high income)Europe & Central Asia (IDA & IBRD countries)European UnionFaroe IslandsFijiFinlandFragile and conflict affected situationsFranceFrench PolynesiaGabonGambia, TheGeorgiaGermanyGhanaGreeceGreenlandGrenadaGuatemalaGuineaGuinea-BissauGuyanaHaitiHeavily indebted poor countries (HIPC)High incomeHondurasHong Kong SAR, ChinaHungaryIBRD onlyIcelandIDA & IBRD totalIDA blendIDA onlyIDA totalIndiaIndonesiaIran, Islamic Rep.IraqIrelandIsraelItalyJamaicaJapanJordanKazakhstanKenyaKiribatiKorea, Rep.KuwaitKyrgyz RepublicLao PDRLate-demographic dividendLatin America & Caribbean Latin America & Caribbean (excluding high income)Latin America & the Caribbean (IDA & IBRD countries)LatviaLeast developed countries: UN classificationLebanonLesothoLiberiaLibyaLithuaniaLow & middle incomeLower middle incomeLuxembourgMacao SAR, ChinaMacedonia, FYRMadagascarMalawiMalaysiaMaldivesMaliMaltaMauritaniaMauritiusMexicoMiddle East & North AfricaMiddle East & North Africa (excluding high income)Middle East & North Africa (IDA & IBRD countries)Middle incomeMoldovaMongoliaMoroccoMozambiqueMyanmarNamibiaNepalNetherlandsNew CaledoniaNew ZealandNicaraguaNigerNigeriaNorth AmericaNorwayOECD membersOmanOther small statesPacific island small statesPakistanPalauPanamaPapua New GuineaParaguayPeruPhilippinesPolandPortugalPost-demographic dividendPre-demographic dividendQatarRomaniaRussian FederationRwandaSamoaSao Tome and PrincipeSaudi ArabiaSenegalSerbiaSeychellesSierra LeoneSingaporeSlovak RepublicSloveniaSmall statesSolomon IslandsSomaliaSouth AfricaSouth AsiaSouth Asia (IDA & IBRD)SpainSri LankaSt. Kitts and NevisSt. LuciaSt. Vincent and the GrenadinesSub-Saharan Africa Sub-Saharan Africa (excluding high income)Sub-Saharan Africa (IDA & IBRD countries)SudanSurinameSwazilandSwedenSwitzerlandSyrian Arab RepublicTajikistanTanzaniaThailandTimor-LesteTogoTongaTrinidad and TobagoTunisiaTurkeyTurkmenistanTurks and Caicos IslandsTuvaluUgandaUkraineUnited Arab EmiratesUnited KingdomUnited StatesUpper middle incomeUruguayVanuatuVenezuela, RBVietnamVirgin Islands (U.S.)WorldYemen, Rep.ZambiaZimbabwe Timeline:
This timeline shows a graph from 1963 to 2014 of Venezuela, RB. No data until 1962. Number of actual observations by date: 51.
Source name:
World Development Indicators
Source organization:
World Bank staff estimates from the Comtrade database maintained by the United Nations Statistics Division.
Categories, topics:
Private Sector, Trade
Last updated:
apr 23, 2017
Indicators value changes by year
At the date of observation
Value
Absolute change
Change from previous value
jan 1, 1963
1.352
+1.352
0.0%
jan 1, 1964
1.974
+0.622
46.01%
jan 1, 1965
1.338
-0.636
-32.23%
jan 1, 1966
1.048
-0.29
-21.66%
jan 1, 1967
1.187
+0.139
13.25%
jan 1, 1968
1.318
+0.131
11.03%
jan 1, 1969
1.171
-0.147
-11.13%
jan 1, 1970
1.133
-0.038
-3.27%
jan 1, 1971
1.653
+0.52
45.93%
jan 1, 1972
1.489
-0.164
-9.9%
jan 1, 1973
2.3
+0.811
54.43%
jan 1, 1974
1.086
-1.214
-52.79%
jan 1, 1975
0.782
-0.304
-27.99%
jan 1, 1976
0.941
+0.159
20.37%
jan 1, 1977
0.92
-0.021
-2.24%
jan 1, 1978
0.995
+0.075
8.16%
jan 1, 1979
1.081
+0.085
8.57%
jan 1, 1980
0.663
-0.417
-38.61%
jan 1, 1981
0.381
-0.283
-42.62%
jan 1, 1982
0.452
+0.072
18.84%
jan 1, 1983
0.586
+0.133
29.47%
jan 1, 1984
0.652
+0.066
11.31%
jan 1, 1985
0.954
+0.303
46.41%
jan 1, 1986
3.227
+2.273
238.12%
jan 1, 1987
2.851
-0.376
-11.65%
jan 1, 1988
1.055
-1.796
-63.01%
jan 1, 1989
0.891
-0.164
-15.5%
jan 1, 1990
1.935
+1.044
117.12%
jan 1, 1991
1.914
-0.021
-1.08%
jan 1, 1992
2.166
+0.252
13.16%
jan 1, 1993
2.559
+0.393
18.14%
jan 1, 1994
2.763
+0.204
7.98%
jan 1, 1995
2.805
+0.041
1.49%
jan 1, 1996
2.815
+0.01
0.36%
jan 1, 1997
2.507
-0.308
-10.94%
jan 1, 1998
2.788
+0.281
11.22%
jan 1, 1999
3.853
+1.064
38.17%
jan 1, 2000
2.641
-1.211
-31.45%
jan 1, 2001
1.493
-1.148
-43.48%
jan 1, 2002
1.716
+0.223
14.95%
jan 1, 2003
1.63
-0.085
-4.97%
jan 1, 2004
1.055
-0.576
-35.31%
jan 1, 2005
0.829
-0.225
-21.36%
jan 1, 2006
0.487
-0.343
-41.32%
jan 1, 2007
0.205
-0.282
-57.89%
jan 1, 2009
0.176
-0.029
-14.11%
jan 1, 2010
0.156
-0.02
-11.52%
jan 1, 2011
0.19
+0.034
21.85%
jan 1, 2012
0.06
-0.13
-68.26%
jan 1, 2013
0.0
-0.06
-100.0%
jan 1, 2014
0.042
+0.042
%
Ranking of countries by current statistics by years


Comments: