29
/
en
AIzaSyAYiBZKx7MnpbEhh9jyipgxe19OcubqV5w
April 1, 2024
206728
Nepal
NPL
true
2
1
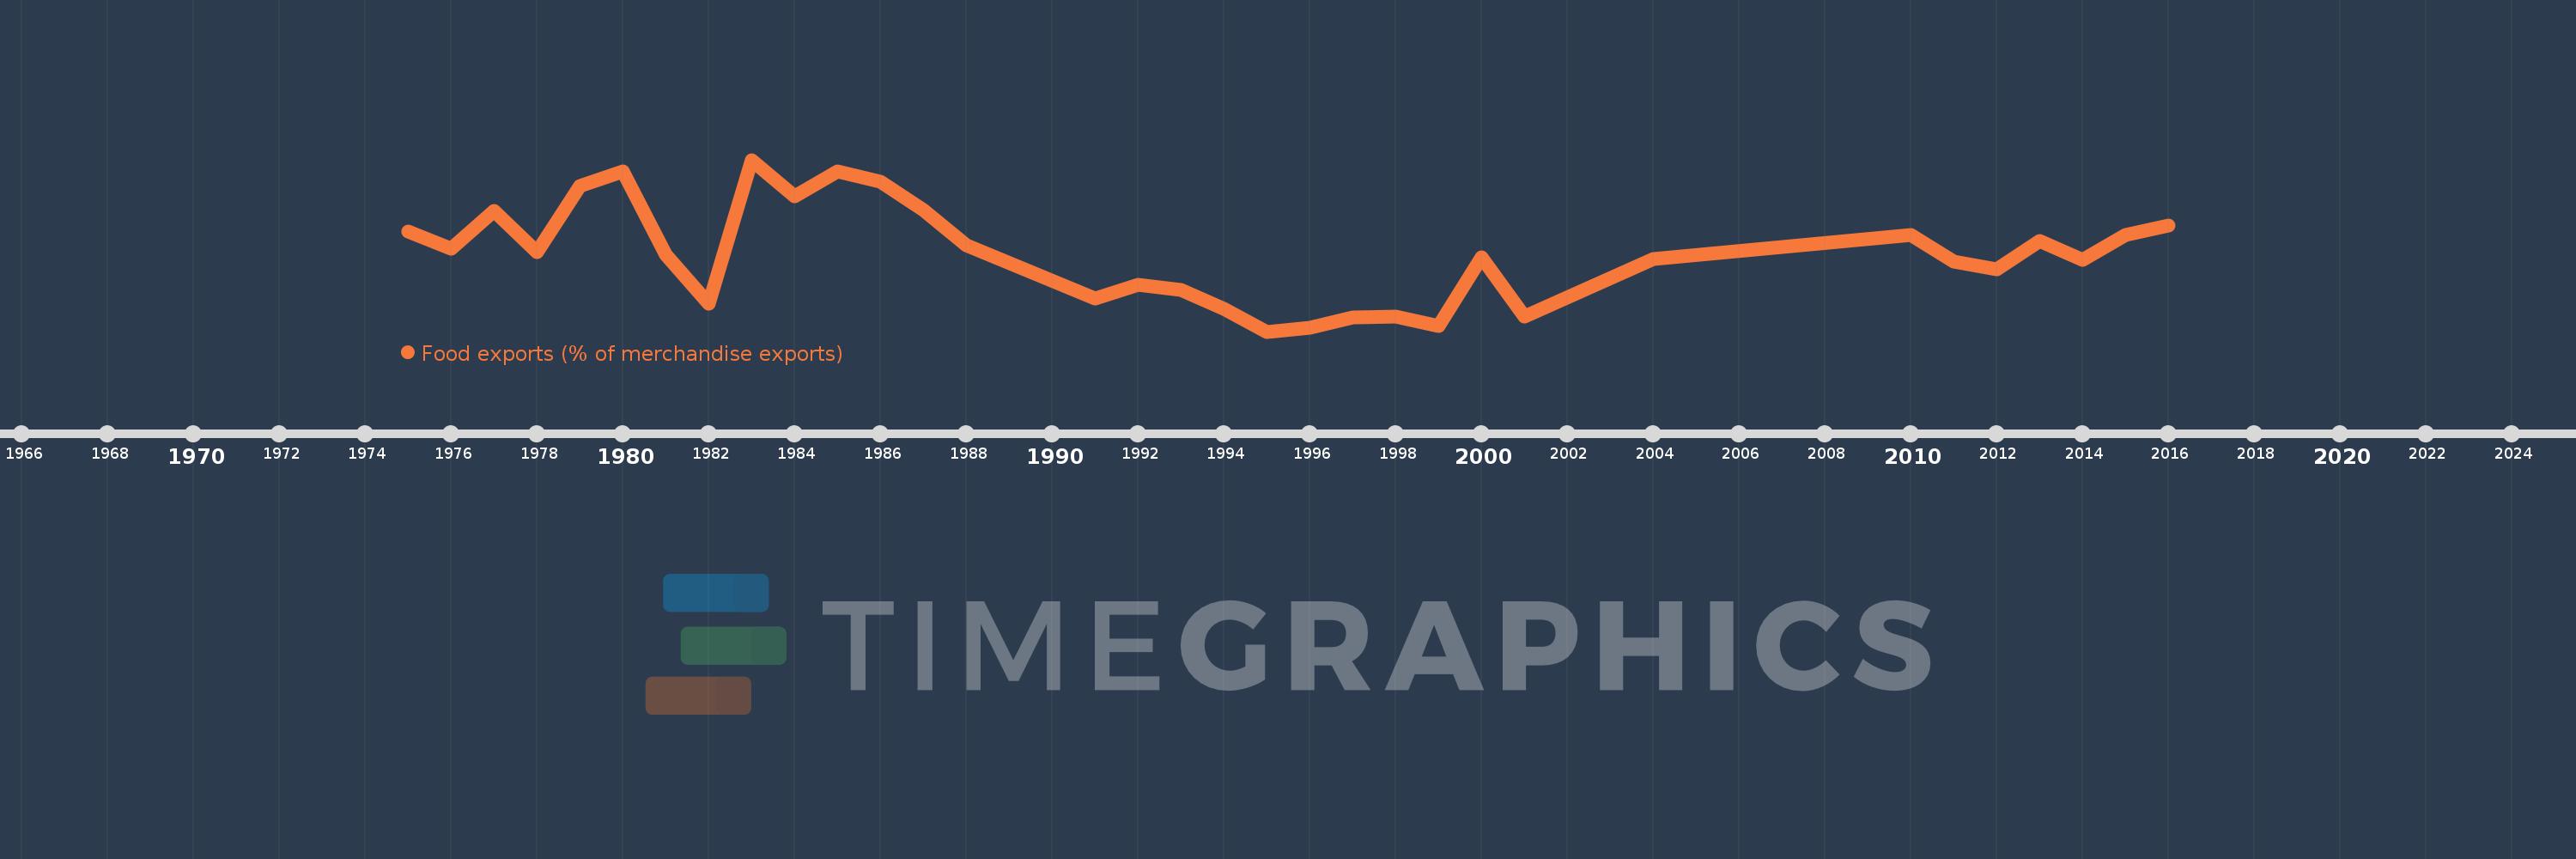
Food exports (% of merchandise exports)
2016,2015,2014,2013,2012,2011,2010,2004,2001,2000,1999,1998,1997,1996,1995,1994,1993,1992,1991,1988,1987,1986,1985,1984,1983,1982,1981,1980,1979,1978,1977,1976,1975
This statistics in other country:
AfghanistanAlbaniaAlgeriaAndorraAngolaAntigua and BarbudaArab WorldArgentinaArmeniaArubaAustraliaAustriaAzerbaijanBahamas, TheBahrainBangladeshBarbadosBelarusBelgiumBelizeBeninBermudaBhutanBoliviaBosnia and HerzegovinaBotswanaBrazilBrunei DarussalamBulgariaBurkina FasoBurundiCabo VerdeCambodiaCameroonCanadaCaribbean small statesCayman IslandsCentral African RepublicCentral Europe and the BalticsChadChileChinaColombiaComorosCongo, Dem. Rep.Congo, Rep.Costa RicaCote d'IvoireCroatiaCubaCyprusCzech RepublicDenmarkDjiboutiDominicaDominican RepublicEarly-demographic dividendEast Asia & PacificEast Asia & Pacific (excluding high income)East Asia & Pacific (IDA & IBRD countries)EcuadorEgypt, Arab Rep.El SalvadorEquatorial GuineaEritreaEstoniaEthiopiaEuro areaEurope & Central AsiaEurope & Central Asia (excluding high income)Europe & Central Asia (IDA & IBRD countries)European UnionFaroe IslandsFijiFinlandFragile and conflict affected situationsFranceFrench PolynesiaGabonGambia, TheGeorgiaGermanyGhanaGreeceGreenlandGrenadaGuatemalaGuineaGuinea-BissauGuyanaHaitiHeavily indebted poor countries (HIPC)High incomeHondurasHong Kong SAR, ChinaHungaryIBRD onlyIcelandIDA & IBRD totalIDA blendIDA onlyIDA totalIndiaIndonesiaIran, Islamic Rep.IraqIrelandIsraelItalyJamaicaJapanJordanKazakhstanKenyaKiribatiKorea, Rep.KuwaitKyrgyz RepublicLao PDRLate-demographic dividendLatin America & Caribbean Latin America & Caribbean (excluding high income)Latin America & the Caribbean (IDA & IBRD countries)LatviaLeast developed countries: UN classificationLebanonLesothoLiberiaLibyaLithuaniaLow & middle incomeLower middle incomeLuxembourgMacao SAR, ChinaMacedonia, FYRMadagascarMalawiMalaysiaMaldivesMaliMaltaMauritaniaMauritiusMexicoMiddle East & North AfricaMiddle East & North Africa (excluding high income)Middle East & North Africa (IDA & IBRD countries)Middle incomeMoldovaMongoliaMoroccoMozambiqueMyanmarNamibiaNepalNetherlandsNew CaledoniaNew ZealandNicaraguaNigerNigeriaNorth AmericaNorwayOECD membersOmanOther small statesPacific island small statesPakistanPalauPanamaPapua New GuineaParaguayPeruPhilippinesPolandPortugalPost-demographic dividendPre-demographic dividendQatarRomaniaRussian FederationRwandaSamoaSao Tome and PrincipeSaudi ArabiaSenegalSerbiaSeychellesSierra LeoneSingaporeSlovak RepublicSloveniaSmall statesSolomon IslandsSomaliaSouth AfricaSouth AsiaSouth Asia (IDA & IBRD)SpainSri LankaSt. Kitts and NevisSt. LuciaSt. Vincent and the GrenadinesSub-Saharan Africa Sub-Saharan Africa (excluding high income)Sub-Saharan Africa (IDA & IBRD countries)SudanSurinameSwazilandSwedenSwitzerlandSyrian Arab RepublicTajikistanTanzaniaThailandTimor-LesteTogoTongaTrinidad and TobagoTunisiaTurkeyTurkmenistanTurks and Caicos IslandsTuvaluUgandaUkraineUnited Arab EmiratesUnited KingdomUnited StatesUpper middle incomeUruguayVanuatuVenezuela, RBVietnamVirgin Islands (U.S.)WorldYemen, Rep.ZambiaZimbabwe Timeline:
This timeline shows a graph from 1975 to 2016 of Nepal. No data until 1974. Number of actual observations by date: 33.
Source name:
World Development Indicators
Source organization:
World Bank staff estimates from the Comtrade database maintained by the United Nations Statistics Division.
Categories, topics:
Private Sector, Trade
Last updated:
apr 23, 2017
Indicators value changes by year
Maximum:
39.147
jan 1, 1983
At the date of observation
Value
Absolute change
Change from previous value
jan 1, 1975
25.712
+25.712
0.0%
jan 1, 1976
22.566
-3.147
-12.24%
jan 1, 1977
29.641
+7.076
31.36%
jan 1, 1978
21.977
-7.664
-25.86%
jan 1, 1979
34.33
+12.352
56.21%
jan 1, 1980
37.035
+2.705
7.88%
jan 1, 1981
21.395
-15.639
-42.23%
jan 1, 1982
12.214
-9.181
-42.91%
jan 1, 1983
39.147
+26.932
220.5%
jan 1, 1984
32.302
-6.845
-17.49%
jan 1, 1985
36.99
+4.689
14.52%
jan 1, 1986
35.082
-1.909
-5.16%
jan 1, 1987
29.751
-5.331
-15.2%
jan 1, 1988
23.139
-6.612
-22.22%
jan 1, 1991
13.237
-9.902
-42.79%
jan 1, 1992
15.748
+2.511
18.97%
jan 1, 1993
14.903
-0.845
-5.36%
jan 1, 1994
11.254
-3.65
-24.49%
jan 1, 1995
7.08
-4.174
-37.09%
jan 1, 1996
7.808
+0.728
10.28%
jan 1, 1997
9.765
+1.957
25.06%
jan 1, 1998
9.957
+0.192
1.97%
jan 1, 1999
8.169
-1.788
-17.96%
jan 1, 2000
20.987
+12.817
156.9%
jan 1, 2001
9.911
-11.076
-52.78%
jan 1, 2004
20.594
+10.683
107.79%
jan 1, 2010
25.115
+4.52
21.95%
jan 1, 2011
20.205
-4.91
-19.55%
jan 1, 2012
18.625
-1.579
-7.82%
jan 1, 2013
23.981
+5.356
28.76%
jan 1, 2014
20.529
-3.452
-14.39%
jan 1, 2015
25.159
+4.629
22.55%
jan 1, 2016
26.896
+1.737
6.9%
Ranking of countries by current statistics by years


Comments: