29
/
en
AIzaSyAYiBZKx7MnpbEhh9jyipgxe19OcubqV5w
April 1, 2024
58073
South Asia (IDA & IBRD)
TSA
false
2
1
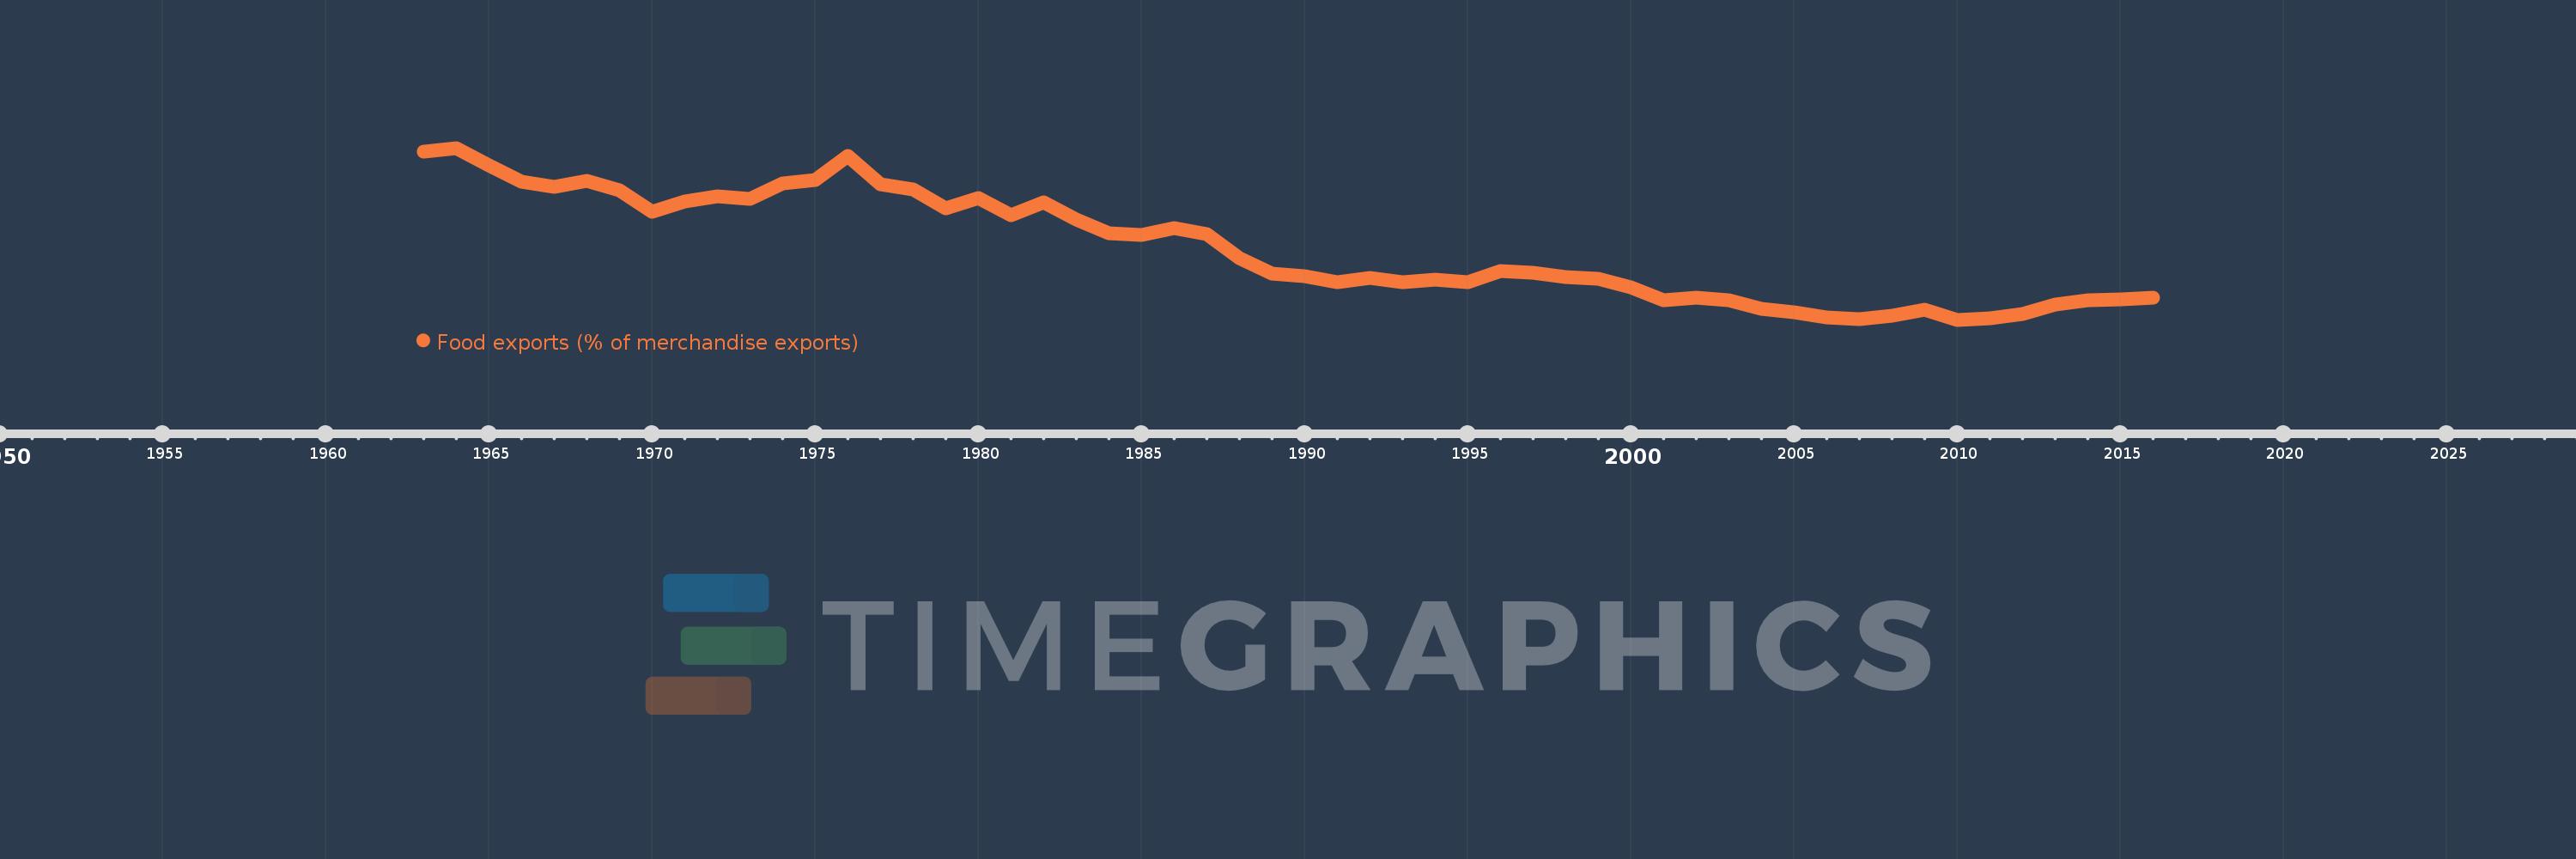
Food exports (% of merchandise exports)
2016,2015,2014,2013,2012,2011,2010,2009,2008,2007,2006,2005,2004,2003,2002,2001,2000,1999,1998,1997,1996,1995,1994,1993,1992,1991,1990,1989,1988,1987,1986,1985,1984,1983,1982,1981,1980,1979,1978,1977,1976,1975,1974,1973,1972,1971,1970,1969,1968,1967,1966,1965,1964,1963
This statistics in other country:
AfghanistanAlbaniaAlgeriaAndorraAngolaAntigua and BarbudaArab WorldArgentinaArmeniaArubaAustraliaAustriaAzerbaijanBahamas, TheBahrainBangladeshBarbadosBelarusBelgiumBelizeBeninBermudaBhutanBoliviaBosnia and HerzegovinaBotswanaBrazilBrunei DarussalamBulgariaBurkina FasoBurundiCabo VerdeCambodiaCameroonCanadaCaribbean small statesCayman IslandsCentral African RepublicCentral Europe and the BalticsChadChileChinaColombiaComorosCongo, Dem. Rep.Congo, Rep.Costa RicaCote d'IvoireCroatiaCubaCyprusCzech RepublicDenmarkDjiboutiDominicaDominican RepublicEarly-demographic dividendEast Asia & PacificEast Asia & Pacific (excluding high income)East Asia & Pacific (IDA & IBRD countries)EcuadorEgypt, Arab Rep.El SalvadorEquatorial GuineaEritreaEstoniaEthiopiaEuro areaEurope & Central AsiaEurope & Central Asia (excluding high income)Europe & Central Asia (IDA & IBRD countries)European UnionFaroe IslandsFijiFinlandFragile and conflict affected situationsFranceFrench PolynesiaGabonGambia, TheGeorgiaGermanyGhanaGreeceGreenlandGrenadaGuatemalaGuineaGuinea-BissauGuyanaHaitiHeavily indebted poor countries (HIPC)High incomeHondurasHong Kong SAR, ChinaHungaryIBRD onlyIcelandIDA & IBRD totalIDA blendIDA onlyIDA totalIndiaIndonesiaIran, Islamic Rep.IraqIrelandIsraelItalyJamaicaJapanJordanKazakhstanKenyaKiribatiKorea, Rep.KuwaitKyrgyz RepublicLao PDRLate-demographic dividendLatin America & Caribbean Latin America & Caribbean (excluding high income)Latin America & the Caribbean (IDA & IBRD countries)LatviaLeast developed countries: UN classificationLebanonLesothoLiberiaLibyaLithuaniaLow & middle incomeLower middle incomeLuxembourgMacao SAR, ChinaMacedonia, FYRMadagascarMalawiMalaysiaMaldivesMaliMaltaMauritaniaMauritiusMexicoMiddle East & North AfricaMiddle East & North Africa (excluding high income)Middle East & North Africa (IDA & IBRD countries)Middle incomeMoldovaMongoliaMoroccoMozambiqueMyanmarNamibiaNepalNetherlandsNew CaledoniaNew ZealandNicaraguaNigerNigeriaNorth AmericaNorwayOECD membersOmanOther small statesPacific island small statesPakistanPalauPanamaPapua New GuineaParaguayPeruPhilippinesPolandPortugalPost-demographic dividendPre-demographic dividendQatarRomaniaRussian FederationRwandaSamoaSao Tome and PrincipeSaudi ArabiaSenegalSerbiaSeychellesSierra LeoneSingaporeSlovak RepublicSloveniaSmall statesSolomon IslandsSomaliaSouth AfricaSouth AsiaSouth Asia (IDA & IBRD)SpainSri LankaSt. Kitts and NevisSt. LuciaSt. Vincent and the GrenadinesSub-Saharan Africa Sub-Saharan Africa (excluding high income)Sub-Saharan Africa (IDA & IBRD countries)SudanSurinameSwazilandSwedenSwitzerlandSyrian Arab RepublicTajikistanTanzaniaThailandTimor-LesteTogoTongaTrinidad and TobagoTunisiaTurkeyTurkmenistanTurks and Caicos IslandsTuvaluUgandaUkraineUnited Arab EmiratesUnited KingdomUnited StatesUpper middle incomeUruguayVanuatuVenezuela, RBVietnamVirgin Islands (U.S.)WorldYemen, Rep.ZambiaZimbabwe Timeline:
This timeline shows a graph from 1963 to 2016 of South Asia (IDA & IBRD). No data until 1962. Number of actual observations by date: 54.
Source name:
World Development Indicators
Source organization:
World Bank staff estimates from the Comtrade database maintained by the United Nations Statistics Division.
Categories, topics:
Private Sector, Trade
Last updated:
apr 23, 2017
Indicators value changes by year
Maximum:
38.876
jan 1, 1964
At the date of observation
Value
Absolute change
Change from previous value
jan 1, 1963
38.195
+38.195
0.0%
jan 1, 1964
38.876
+0.681
1.78%
jan 1, 1965
35.837
-3.039
-7.82%
jan 1, 1966
32.978
-2.859
-7.98%
jan 1, 1967
32.171
-0.807
-2.45%
jan 1, 1968
33.169
+0.998
3.1%
jan 1, 1969
31.503
-1.666
-5.02%
jan 1, 1970
27.77
-3.733
-11.85%
jan 1, 1971
29.535
+1.765
6.36%
jan 1, 1972
30.557
+1.022
3.46%
jan 1, 1973
30.03
-0.527
-1.73%
jan 1, 1974
32.67
+2.64
8.79%
jan 1, 1975
33.323
+0.653
2.0%
jan 1, 1976
37.468
+4.146
12.44%
jan 1, 1977
32.524
-4.944
-13.2%
jan 1, 1978
31.705
-0.819
-2.52%
jan 1, 1979
28.421
-3.284
-10.36%
jan 1, 1980
30.233
+1.812
6.38%
jan 1, 1981
27.281
-2.952
-9.77%
jan 1, 1982
29.39
+2.109
7.73%
jan 1, 1983
26.432
-2.958
-10.06%
jan 1, 1984
24.145
-2.287
-8.65%
jan 1, 1985
23.796
-0.349
-1.45%
jan 1, 1986
24.925
+1.129
4.75%
jan 1, 1987
23.923
-1.002
-4.02%
jan 1, 1988
19.717
-4.206
-17.58%
jan 1, 1989
17.149
-2.568
-13.02%
jan 1, 1990
16.695
-0.454
-2.64%
jan 1, 1991
15.58
-1.115
-6.68%
jan 1, 1992
16.422
+0.841
5.4%
jan 1, 1993
15.552
-0.87
-5.3%
jan 1, 1994
16.042
+0.491
3.15%
jan 1, 1995
15.563
-0.479
-2.99%
jan 1, 1996
17.544
+1.981
12.73%
jan 1, 1997
17.19
-0.355
-2.02%
jan 1, 1998
16.495
-0.694
-4.04%
jan 1, 1999
16.184
-0.312
-1.89%
jan 1, 2000
14.649
-1.535
-9.49%
jan 1, 2001
12.509
-2.139
-14.6%
jan 1, 2002
12.874
+0.364
2.91%
jan 1, 2003
12.459
-0.414
-3.22%
jan 1, 2004
11.053
-1.406
-11.28%
jan 1, 2005
10.442
-0.611
-5.53%
jan 1, 2006
9.501
-0.941
-9.01%
jan 1, 2007
9.138
-0.364
-3.83%
jan 1, 2008
9.769
+0.632
6.91%
jan 1, 2009
10.92
+1.151
11.78%
jan 1, 2010
9.104
-1.816
-16.63%
jan 1, 2011
9.342
+0.238
2.62%
jan 1, 2012
10.08
+0.737
7.89%
jan 1, 2013
11.727
+1.648
16.35%
jan 1, 2014
12.537
+0.809
6.9%
jan 1, 2015
12.67
+0.133
1.06%
jan 1, 2016
12.89
+0.221
1.74%
Ranking of countries by current statistics by years


Comments: