29
/
en
AIzaSyAYiBZKx7MnpbEhh9jyipgxe19OcubqV5w
April 1, 2024
102415
Central African Republic
CAF
true
2
1
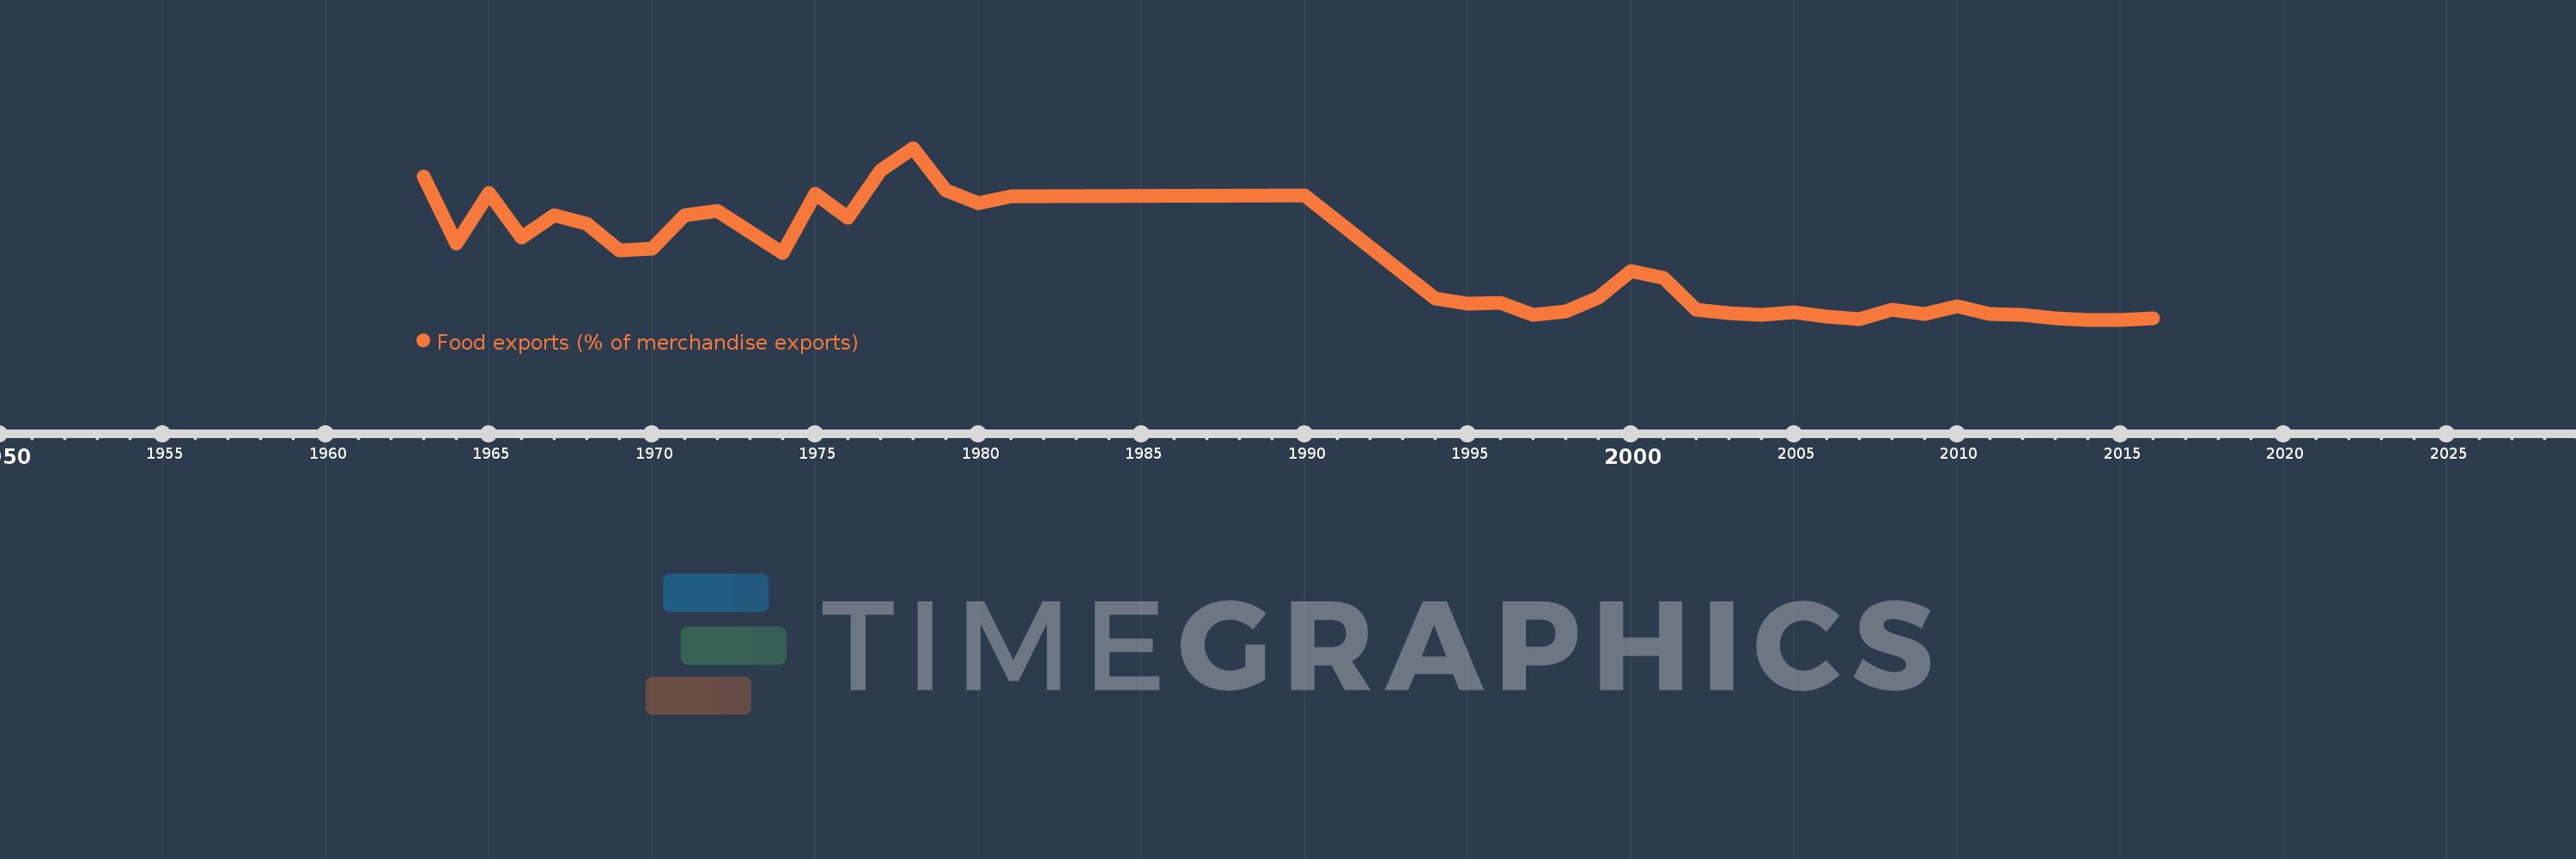
Food exports (% of merchandise exports)
2016,2015,2014,2013,2012,2011,2010,2009,2008,2007,2006,2005,2004,2003,2002,2001,2000,1999,1998,1997,1996,1995,1994,1990,1981,1980,1979,1978,1977,1976,1975,1974,1972,1971,1970,1969,1968,1967,1966,1965,1964,1963
This statistics in other country:
AfghanistanAlbaniaAlgeriaAndorraAngolaAntigua and BarbudaArab WorldArgentinaArmeniaArubaAustraliaAustriaAzerbaijanBahamas, TheBahrainBangladeshBarbadosBelarusBelgiumBelizeBeninBermudaBhutanBoliviaBosnia and HerzegovinaBotswanaBrazilBrunei DarussalamBulgariaBurkina FasoBurundiCabo VerdeCambodiaCameroonCanadaCaribbean small statesCayman IslandsCentral African RepublicCentral Europe and the BalticsChadChileChinaColombiaComorosCongo, Dem. Rep.Congo, Rep.Costa RicaCote d'IvoireCroatiaCubaCyprusCzech RepublicDenmarkDjiboutiDominicaDominican RepublicEarly-demographic dividendEast Asia & PacificEast Asia & Pacific (excluding high income)East Asia & Pacific (IDA & IBRD countries)EcuadorEgypt, Arab Rep.El SalvadorEquatorial GuineaEritreaEstoniaEthiopiaEuro areaEurope & Central AsiaEurope & Central Asia (excluding high income)Europe & Central Asia (IDA & IBRD countries)European UnionFaroe IslandsFijiFinlandFragile and conflict affected situationsFranceFrench PolynesiaGabonGambia, TheGeorgiaGermanyGhanaGreeceGreenlandGrenadaGuatemalaGuineaGuinea-BissauGuyanaHaitiHeavily indebted poor countries (HIPC)High incomeHondurasHong Kong SAR, ChinaHungaryIBRD onlyIcelandIDA & IBRD totalIDA blendIDA onlyIDA totalIndiaIndonesiaIran, Islamic Rep.IraqIrelandIsraelItalyJamaicaJapanJordanKazakhstanKenyaKiribatiKorea, Rep.KuwaitKyrgyz RepublicLao PDRLate-demographic dividendLatin America & Caribbean Latin America & Caribbean (excluding high income)Latin America & the Caribbean (IDA & IBRD countries)LatviaLeast developed countries: UN classificationLebanonLesothoLiberiaLibyaLithuaniaLow & middle incomeLower middle incomeLuxembourgMacao SAR, ChinaMacedonia, FYRMadagascarMalawiMalaysiaMaldivesMaliMaltaMauritaniaMauritiusMexicoMiddle East & North AfricaMiddle East & North Africa (excluding high income)Middle East & North Africa (IDA & IBRD countries)Middle incomeMoldovaMongoliaMoroccoMozambiqueMyanmarNamibiaNepalNetherlandsNew CaledoniaNew ZealandNicaraguaNigerNigeriaNorth AmericaNorwayOECD membersOmanOther small statesPacific island small statesPakistanPalauPanamaPapua New GuineaParaguayPeruPhilippinesPolandPortugalPost-demographic dividendPre-demographic dividendQatarRomaniaRussian FederationRwandaSamoaSao Tome and PrincipeSaudi ArabiaSenegalSerbiaSeychellesSierra LeoneSingaporeSlovak RepublicSloveniaSmall statesSolomon IslandsSomaliaSouth AfricaSouth AsiaSouth Asia (IDA & IBRD)SpainSri LankaSt. Kitts and NevisSt. LuciaSt. Vincent and the GrenadinesSub-Saharan Africa Sub-Saharan Africa (excluding high income)Sub-Saharan Africa (IDA & IBRD countries)SudanSurinameSwazilandSwedenSwitzerlandSyrian Arab RepublicTajikistanTanzaniaThailandTimor-LesteTogoTongaTrinidad and TobagoTunisiaTurkeyTurkmenistanTurks and Caicos IslandsTuvaluUgandaUkraineUnited Arab EmiratesUnited KingdomUnited StatesUpper middle incomeUruguayVanuatuVenezuela, RBVietnamVirgin Islands (U.S.)WorldYemen, Rep.ZambiaZimbabwe Timeline:
This timeline shows a graph from 1963 to 2016 of Central African Republic. No data until 1962. Number of actual observations by date: 42.
Source name:
World Development Indicators
Source organization:
World Bank staff estimates from the Comtrade database maintained by the United Nations Statistics Division.
Categories, topics:
Private Sector, Trade
Last updated:
apr 23, 2017
Indicators value changes by year
Maximum:
43.015
jan 1, 1978
At the date of observation
Value
Absolute change
Change from previous value
jan 1, 1963
35.944
+35.944
0.0%
jan 1, 1964
19.119
-16.825
-46.81%
jan 1, 1965
31.887
+12.767
66.78%
jan 1, 1966
20.74
-11.147
-34.96%
jan 1, 1967
26.246
+5.506
26.55%
jan 1, 1968
24.152
-2.094
-7.98%
jan 1, 1969
17.5
-6.653
-27.55%
jan 1, 1970
17.891
+0.392
2.24%
jan 1, 1971
26.281
+8.39
46.9%
jan 1, 1972
27.272
+0.991
3.77%
jan 1, 1974
16.73
-10.542
-38.65%
jan 1, 1975
31.505
+14.775
88.31%
jan 1, 1976
25.651
-5.854
-18.58%
jan 1, 1977
37.301
+11.65
45.42%
jan 1, 1978
43.015
+5.714
15.32%
jan 1, 1979
32.489
-10.526
-24.47%
jan 1, 1980
29.248
-3.241
-9.98%
jan 1, 1981
30.982
+1.734
5.93%
jan 1, 1990
31.083
+0.1
0.32%
jan 1, 1994
5.338
-25.745
-82.83%
jan 1, 1995
4.203
-1.135
-21.25%
jan 1, 1996
4.236
+0.032
0.77%
jan 1, 1997
1.257
-2.979
-70.33%
jan 1, 1998
2.18
+0.923
73.49%
jan 1, 1999
5.714
+3.534
162.09%
jan 1, 2000
12.303
+6.589
115.32%
jan 1, 2001
10.65
-1.652
-13.43%
jan 1, 2002
2.715
-7.935
-74.51%
jan 1, 2003
1.682
-1.033
-38.03%
jan 1, 2004
1.386
-0.297
-17.63%
jan 1, 2005
1.891
+0.506
36.49%
jan 1, 2006
0.836
-1.056
-55.81%
jan 1, 2007
0.25
-0.586
-70.1%
jan 1, 2008
2.703
+2.453
981.44%
jan 1, 2009
1.445
-1.258
-46.53%
jan 1, 2010
3.563
+2.118
146.57%
jan 1, 2011
1.546
-2.017
-56.61%
jan 1, 2012
1.238
-0.308
-19.93%
jan 1, 2013
0.435
-0.803
-64.82%
jan 1, 2014
0.127
-0.309
-70.92%
jan 1, 2015
0.103
-0.024
-18.78%
jan 1, 2016
0.523
+0.42
408.09%
Ranking of countries by current statistics by years


Comments: