29
/
en
AIzaSyAYiBZKx7MnpbEhh9jyipgxe19OcubqV5w
April 1, 2024
182910
Macao SAR, China
MAC
true
2
1
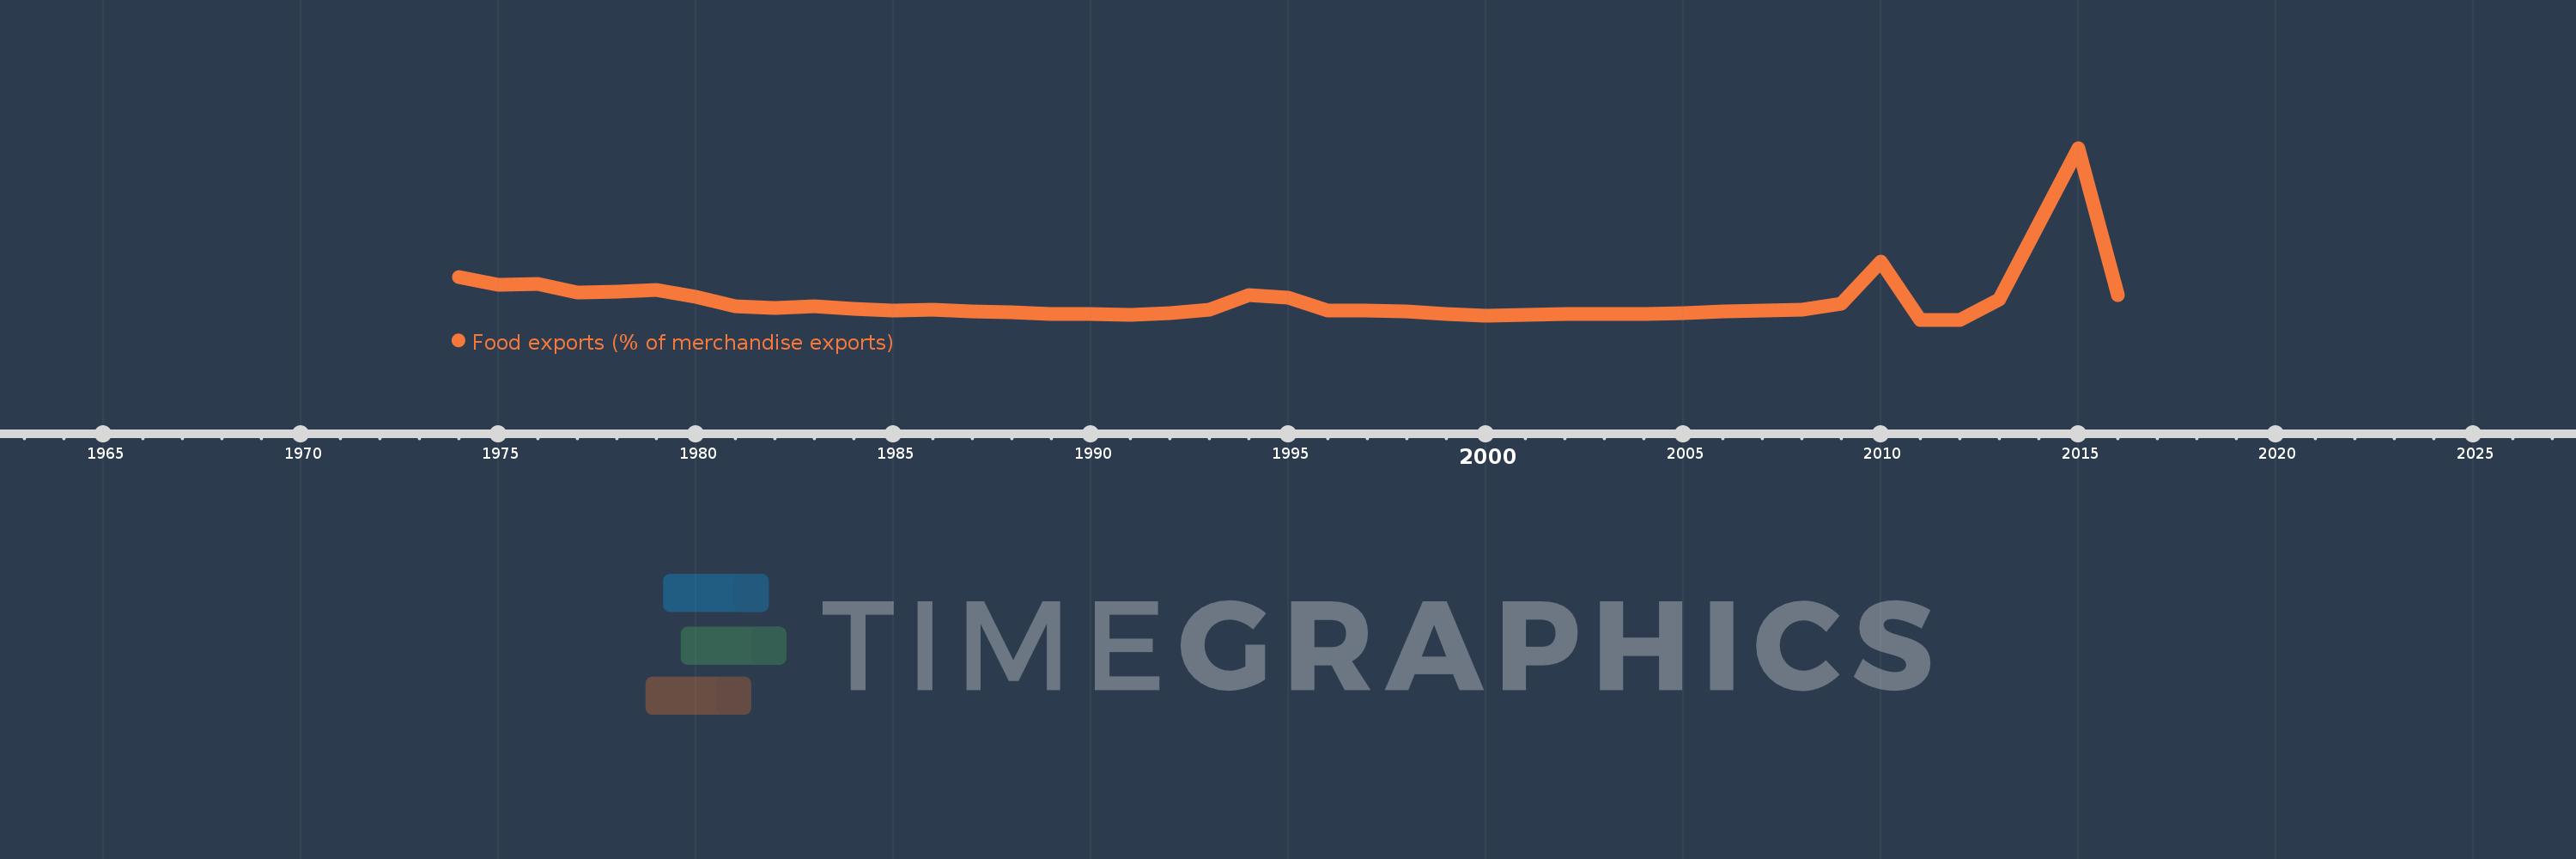
Food exports (% of merchandise exports)
2016,2015,2013,2012,2011,2010,2009,2008,2007,2006,2005,2004,2003,2002,2001,2000,1999,1998,1997,1996,1995,1994,1993,1992,1991,1990,1989,1988,1987,1986,1985,1984,1983,1982,1981,1980,1979,1978,1977,1976,1975,1974
This statistics in other country:
AfghanistanAlbaniaAlgeriaAndorraAngolaAntigua and BarbudaArab WorldArgentinaArmeniaArubaAustraliaAustriaAzerbaijanBahamas, TheBahrainBangladeshBarbadosBelarusBelgiumBelizeBeninBermudaBhutanBoliviaBosnia and HerzegovinaBotswanaBrazilBrunei DarussalamBulgariaBurkina FasoBurundiCabo VerdeCambodiaCameroonCanadaCaribbean small statesCayman IslandsCentral African RepublicCentral Europe and the BalticsChadChileChinaColombiaComorosCongo, Dem. Rep.Congo, Rep.Costa RicaCote d'IvoireCroatiaCubaCyprusCzech RepublicDenmarkDjiboutiDominicaDominican RepublicEarly-demographic dividendEast Asia & PacificEast Asia & Pacific (excluding high income)East Asia & Pacific (IDA & IBRD countries)EcuadorEgypt, Arab Rep.El SalvadorEquatorial GuineaEritreaEstoniaEthiopiaEuro areaEurope & Central AsiaEurope & Central Asia (excluding high income)Europe & Central Asia (IDA & IBRD countries)European UnionFaroe IslandsFijiFinlandFragile and conflict affected situationsFranceFrench PolynesiaGabonGambia, TheGeorgiaGermanyGhanaGreeceGreenlandGrenadaGuatemalaGuineaGuinea-BissauGuyanaHaitiHeavily indebted poor countries (HIPC)High incomeHondurasHong Kong SAR, ChinaHungaryIBRD onlyIcelandIDA & IBRD totalIDA blendIDA onlyIDA totalIndiaIndonesiaIran, Islamic Rep.IraqIrelandIsraelItalyJamaicaJapanJordanKazakhstanKenyaKiribatiKorea, Rep.KuwaitKyrgyz RepublicLao PDRLate-demographic dividendLatin America & Caribbean Latin America & Caribbean (excluding high income)Latin America & the Caribbean (IDA & IBRD countries)LatviaLeast developed countries: UN classificationLebanonLesothoLiberiaLibyaLithuaniaLow & middle incomeLower middle incomeLuxembourgMacao SAR, ChinaMacedonia, FYRMadagascarMalawiMalaysiaMaldivesMaliMaltaMauritaniaMauritiusMexicoMiddle East & North AfricaMiddle East & North Africa (excluding high income)Middle East & North Africa (IDA & IBRD countries)Middle incomeMoldovaMongoliaMoroccoMozambiqueMyanmarNamibiaNepalNetherlandsNew CaledoniaNew ZealandNicaraguaNigerNigeriaNorth AmericaNorwayOECD membersOmanOther small statesPacific island small statesPakistanPalauPanamaPapua New GuineaParaguayPeruPhilippinesPolandPortugalPost-demographic dividendPre-demographic dividendQatarRomaniaRussian FederationRwandaSamoaSao Tome and PrincipeSaudi ArabiaSenegalSerbiaSeychellesSierra LeoneSingaporeSlovak RepublicSloveniaSmall statesSolomon IslandsSomaliaSouth AfricaSouth AsiaSouth Asia (IDA & IBRD)SpainSri LankaSt. Kitts and NevisSt. LuciaSt. Vincent and the GrenadinesSub-Saharan Africa Sub-Saharan Africa (excluding high income)Sub-Saharan Africa (IDA & IBRD countries)SudanSurinameSwazilandSwedenSwitzerlandSyrian Arab RepublicTajikistanTanzaniaThailandTimor-LesteTogoTongaTrinidad and TobagoTunisiaTurkeyTurkmenistanTurks and Caicos IslandsTuvaluUgandaUkraineUnited Arab EmiratesUnited KingdomUnited StatesUpper middle incomeUruguayVanuatuVenezuela, RBVietnamVirgin Islands (U.S.)WorldYemen, Rep.ZambiaZimbabwe Timeline:
This timeline shows a graph from 1974 to 2016 of Macao SAR, China. No data until 1973. Number of actual observations by date: 42.
Source name:
World Development Indicators
Source organization:
World Bank staff estimates from the Comtrade database maintained by the United Nations Statistics Division.
Categories, topics:
Private Sector, Trade
Last updated:
apr 23, 2017
Indicators value changes by year
Maximum:
27.201
jan 1, 2015
At the date of observation
Value
Absolute change
Change from previous value
jan 1, 1974
6.899
+6.899
0.0%
jan 1, 1975
5.739
-1.16
-16.82%
jan 1, 1976
5.889
+0.15
2.61%
jan 1, 1977
4.452
-1.436
-24.39%
jan 1, 1978
4.653
+0.2
4.5%
jan 1, 1979
4.881
+0.228
4.9%
jan 1, 1980
3.808
-1.073
-21.98%
jan 1, 1981
2.375
-1.432
-37.62%
jan 1, 1982
2.002
-0.373
-15.71%
jan 1, 1983
2.357
+0.354
17.7%
jan 1, 1984
1.974
-0.382
-16.21%
jan 1, 1985
1.646
-0.328
-16.63%
jan 1, 1986
1.76
+0.114
6.94%
jan 1, 1987
1.502
-0.258
-14.66%
jan 1, 1988
1.351
-0.151
-10.04%
jan 1, 1989
1.136
-0.216
-15.96%
jan 1, 1990
1.051
-0.085
-7.47%
jan 1, 1991
0.955
-0.096
-9.18%
jan 1, 1992
1.302
+0.348
36.45%
jan 1, 1993
1.852
+0.55
42.23%
jan 1, 1994
4.044
+2.192
118.33%
jan 1, 1995
3.712
-0.332
-8.21%
jan 1, 1996
1.707
-2.006
-54.03%
jan 1, 1997
1.661
-0.046
-2.7%
jan 1, 1998
1.533
-0.127
-7.66%
jan 1, 1999
1.055
-0.478
-31.17%
jan 1, 2000
0.807
-0.248
-23.53%
jan 1, 2001
0.917
+0.11
13.58%
jan 1, 2002
1.073
+0.156
17.04%
jan 1, 2003
1.128
+0.056
5.19%
jan 1, 2004
1.095
-0.033
-2.94%
jan 1, 2005
1.194
+0.098
8.98%
jan 1, 2006
1.583
+0.389
32.59%
jan 1, 2007
1.612
+0.029
1.84%
jan 1, 2008
1.786
+0.174
10.82%
jan 1, 2009
2.788
+1.001
56.06%
jan 1, 2010
9.343
+6.555
235.16%
jan 1, 2011
0.213
-9.13
-97.72%
jan 1, 2012
0.235
+0.022
10.33%
jan 1, 2013
3.355
+3.12
1.33K%
jan 1, 2015
27.201
+23.846
710.84%
jan 1, 2016
4.095
-23.106
-84.95%
Ranking of countries by current statistics by years


Comments: