29
/
en
AIzaSyAYiBZKx7MnpbEhh9jyipgxe19OcubqV5w
April 1, 2024
26495
Early-demographic dividend
EAR
false
2
1
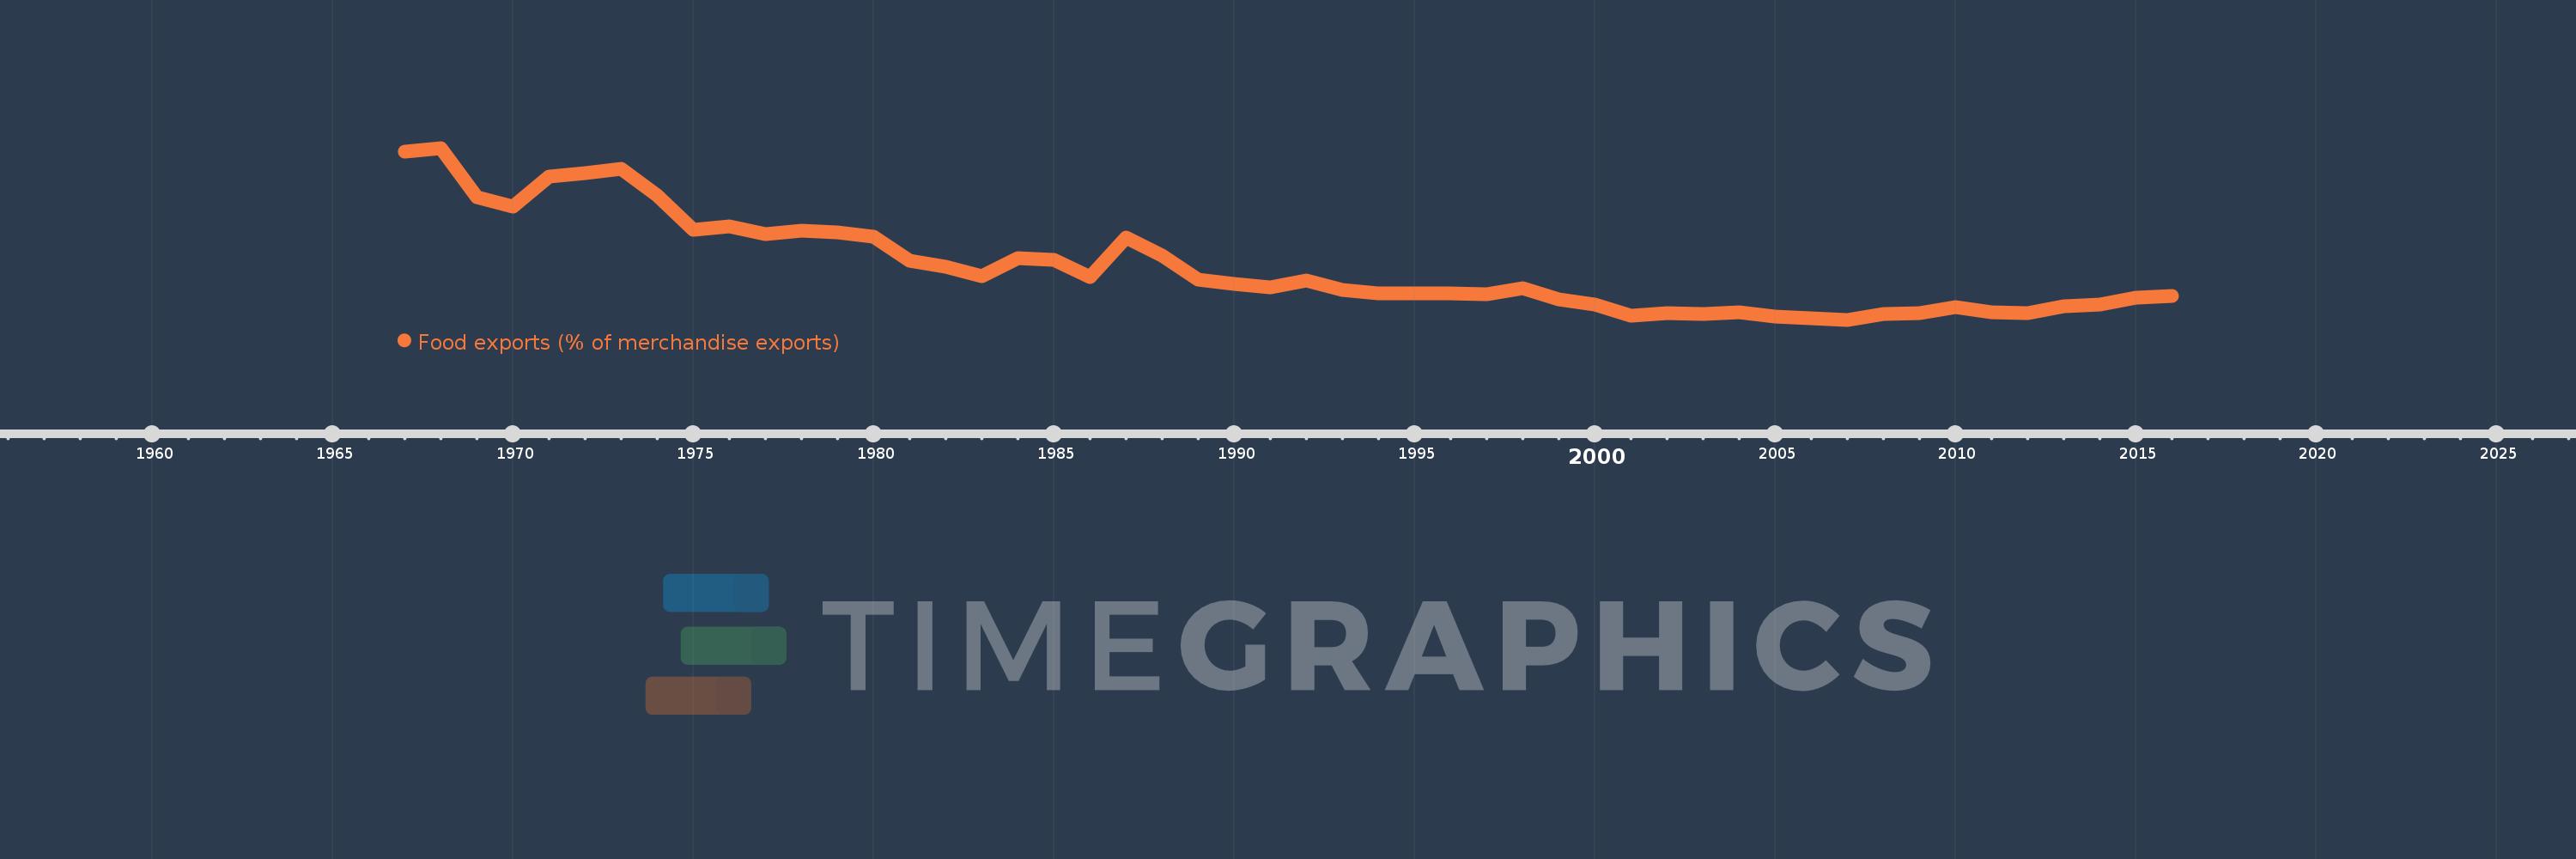
Food exports (% of merchandise exports)
2016,2015,2014,2013,2012,2011,2010,2009,2008,2007,2006,2005,2004,2003,2002,2001,2000,1999,1998,1997,1996,1995,1994,1993,1992,1991,1990,1989,1988,1987,1986,1985,1984,1983,1982,1981,1980,1979,1978,1977,1976,1975,1974,1973,1972,1971,1970,1969,1968,1967
This statistics in other country:
AfghanistanAlbaniaAlgeriaAndorraAngolaAntigua and BarbudaArab WorldArgentinaArmeniaArubaAustraliaAustriaAzerbaijanBahamas, TheBahrainBangladeshBarbadosBelarusBelgiumBelizeBeninBermudaBhutanBoliviaBosnia and HerzegovinaBotswanaBrazilBrunei DarussalamBulgariaBurkina FasoBurundiCabo VerdeCambodiaCameroonCanadaCaribbean small statesCayman IslandsCentral African RepublicCentral Europe and the BalticsChadChileChinaColombiaComorosCongo, Dem. Rep.Congo, Rep.Costa RicaCote d'IvoireCroatiaCubaCyprusCzech RepublicDenmarkDjiboutiDominicaDominican RepublicEarly-demographic dividendEast Asia & PacificEast Asia & Pacific (excluding high income)East Asia & Pacific (IDA & IBRD countries)EcuadorEgypt, Arab Rep.El SalvadorEquatorial GuineaEritreaEstoniaEthiopiaEuro areaEurope & Central AsiaEurope & Central Asia (excluding high income)Europe & Central Asia (IDA & IBRD countries)European UnionFaroe IslandsFijiFinlandFragile and conflict affected situationsFranceFrench PolynesiaGabonGambia, TheGeorgiaGermanyGhanaGreeceGreenlandGrenadaGuatemalaGuineaGuinea-BissauGuyanaHaitiHeavily indebted poor countries (HIPC)High incomeHondurasHong Kong SAR, ChinaHungaryIBRD onlyIcelandIDA & IBRD totalIDA blendIDA onlyIDA totalIndiaIndonesiaIran, Islamic Rep.IraqIrelandIsraelItalyJamaicaJapanJordanKazakhstanKenyaKiribatiKorea, Rep.KuwaitKyrgyz RepublicLao PDRLate-demographic dividendLatin America & Caribbean Latin America & Caribbean (excluding high income)Latin America & the Caribbean (IDA & IBRD countries)LatviaLeast developed countries: UN classificationLebanonLesothoLiberiaLibyaLithuaniaLow & middle incomeLower middle incomeLuxembourgMacao SAR, ChinaMacedonia, FYRMadagascarMalawiMalaysiaMaldivesMaliMaltaMauritaniaMauritiusMexicoMiddle East & North AfricaMiddle East & North Africa (excluding high income)Middle East & North Africa (IDA & IBRD countries)Middle incomeMoldovaMongoliaMoroccoMozambiqueMyanmarNamibiaNepalNetherlandsNew CaledoniaNew ZealandNicaraguaNigerNigeriaNorth AmericaNorwayOECD membersOmanOther small statesPacific island small statesPakistanPalauPanamaPapua New GuineaParaguayPeruPhilippinesPolandPortugalPost-demographic dividendPre-demographic dividendQatarRomaniaRussian FederationRwandaSamoaSao Tome and PrincipeSaudi ArabiaSenegalSerbiaSeychellesSierra LeoneSingaporeSlovak RepublicSloveniaSmall statesSolomon IslandsSomaliaSouth AfricaSouth AsiaSouth Asia (IDA & IBRD)SpainSri LankaSt. Kitts and NevisSt. LuciaSt. Vincent and the GrenadinesSub-Saharan Africa Sub-Saharan Africa (excluding high income)Sub-Saharan Africa (IDA & IBRD countries)SudanSurinameSwazilandSwedenSwitzerlandSyrian Arab RepublicTajikistanTanzaniaThailandTimor-LesteTogoTongaTrinidad and TobagoTunisiaTurkeyTurkmenistanTurks and Caicos IslandsTuvaluUgandaUkraineUnited Arab EmiratesUnited KingdomUnited StatesUpper middle incomeUruguayVanuatuVenezuela, RBVietnamVirgin Islands (U.S.)WorldYemen, Rep.ZambiaZimbabwe Timeline:
This timeline shows a graph from 1967 to 2016 of Early-demographic dividend. No data until 1966. Number of actual observations by date: 50.
Source name:
World Development Indicators
Source organization:
World Bank staff estimates from the Comtrade database maintained by the United Nations Statistics Division.
Categories, topics:
Private Sector, Trade
Last updated:
apr 23, 2017
Indicators value changes by year
Maximum:
36.377
jan 1, 1968
At the date of observation
Value
Absolute change
Change from previous value
jan 1, 1967
35.788
+35.788
0.0%
jan 1, 1968
36.377
+0.589
1.65%
jan 1, 1969
28.607
-7.77
-21.36%
jan 1, 1970
27.129
-1.479
-5.17%
jan 1, 1971
31.85
+4.721
17.4%
jan 1, 1972
32.44
+0.591
1.85%
jan 1, 1973
33.117
+0.676
2.08%
jan 1, 1974
28.927
-4.19
-12.65%
jan 1, 1975
23.572
-5.355
-18.51%
jan 1, 1976
24.1
+0.529
2.24%
jan 1, 1977
22.93
-1.17
-4.86%
jan 1, 1978
23.437
+0.507
2.21%
jan 1, 1979
23.151
-0.286
-1.22%
jan 1, 1980
22.503
-0.648
-2.8%
jan 1, 1981
18.7
-3.803
-16.9%
jan 1, 1982
17.747
-0.953
-5.1%
jan 1, 1983
16.304
-1.443
-8.13%
jan 1, 1984
19.074
+2.77
16.99%
jan 1, 1985
18.77
-0.304
-1.59%
jan 1, 1986
16.107
-2.663
-14.19%
jan 1, 1987
22.317
+6.21
38.56%
jan 1, 1988
19.455
-2.862
-12.83%
jan 1, 1989
15.688
-3.766
-19.36%
jan 1, 1990
15.116
-0.573
-3.65%
jan 1, 1991
14.558
-0.557
-3.69%
jan 1, 1992
15.529
+0.971
6.67%
jan 1, 1993
14.078
-1.451
-9.35%
jan 1, 1994
13.614
-0.464
-3.29%
jan 1, 1995
13.513
-0.101
-0.74%
jan 1, 1996
13.614
+0.101
0.75%
jan 1, 1997
13.429
-0.185
-1.36%
jan 1, 1998
14.368
+0.938
6.99%
jan 1, 1999
12.669
-1.699
-11.83%
jan 1, 2000
11.756
-0.912
-7.2%
jan 1, 2001
10.108
-1.649
-14.02%
jan 1, 2002
10.515
+0.408
4.03%
jan 1, 2003
10.364
-0.151
-1.44%
jan 1, 2004
10.593
+0.229
2.21%
jan 1, 2005
9.879
-0.714
-6.74%
jan 1, 2006
9.711
-0.168
-1.7%
jan 1, 2007
9.436
-0.275
-2.83%
jan 1, 2008
10.343
+0.907
9.61%
jan 1, 2009
10.505
+0.162
1.57%
jan 1, 2010
11.422
+0.917
8.73%
jan 1, 2011
10.644
-0.778
-6.81%
jan 1, 2012
10.442
-0.202
-1.9%
jan 1, 2013
11.484
+1.042
9.98%
jan 1, 2014
11.786
+0.302
2.63%
jan 1, 2015
12.911
+1.125
9.54%
jan 1, 2016
13.164
+0.253
1.96%
Ranking of countries by current statistics by years


Comments: