29
/
en
AIzaSyAYiBZKx7MnpbEhh9jyipgxe19OcubqV5w
April 1, 2024
254102
Suriname
SUR
true
2
1
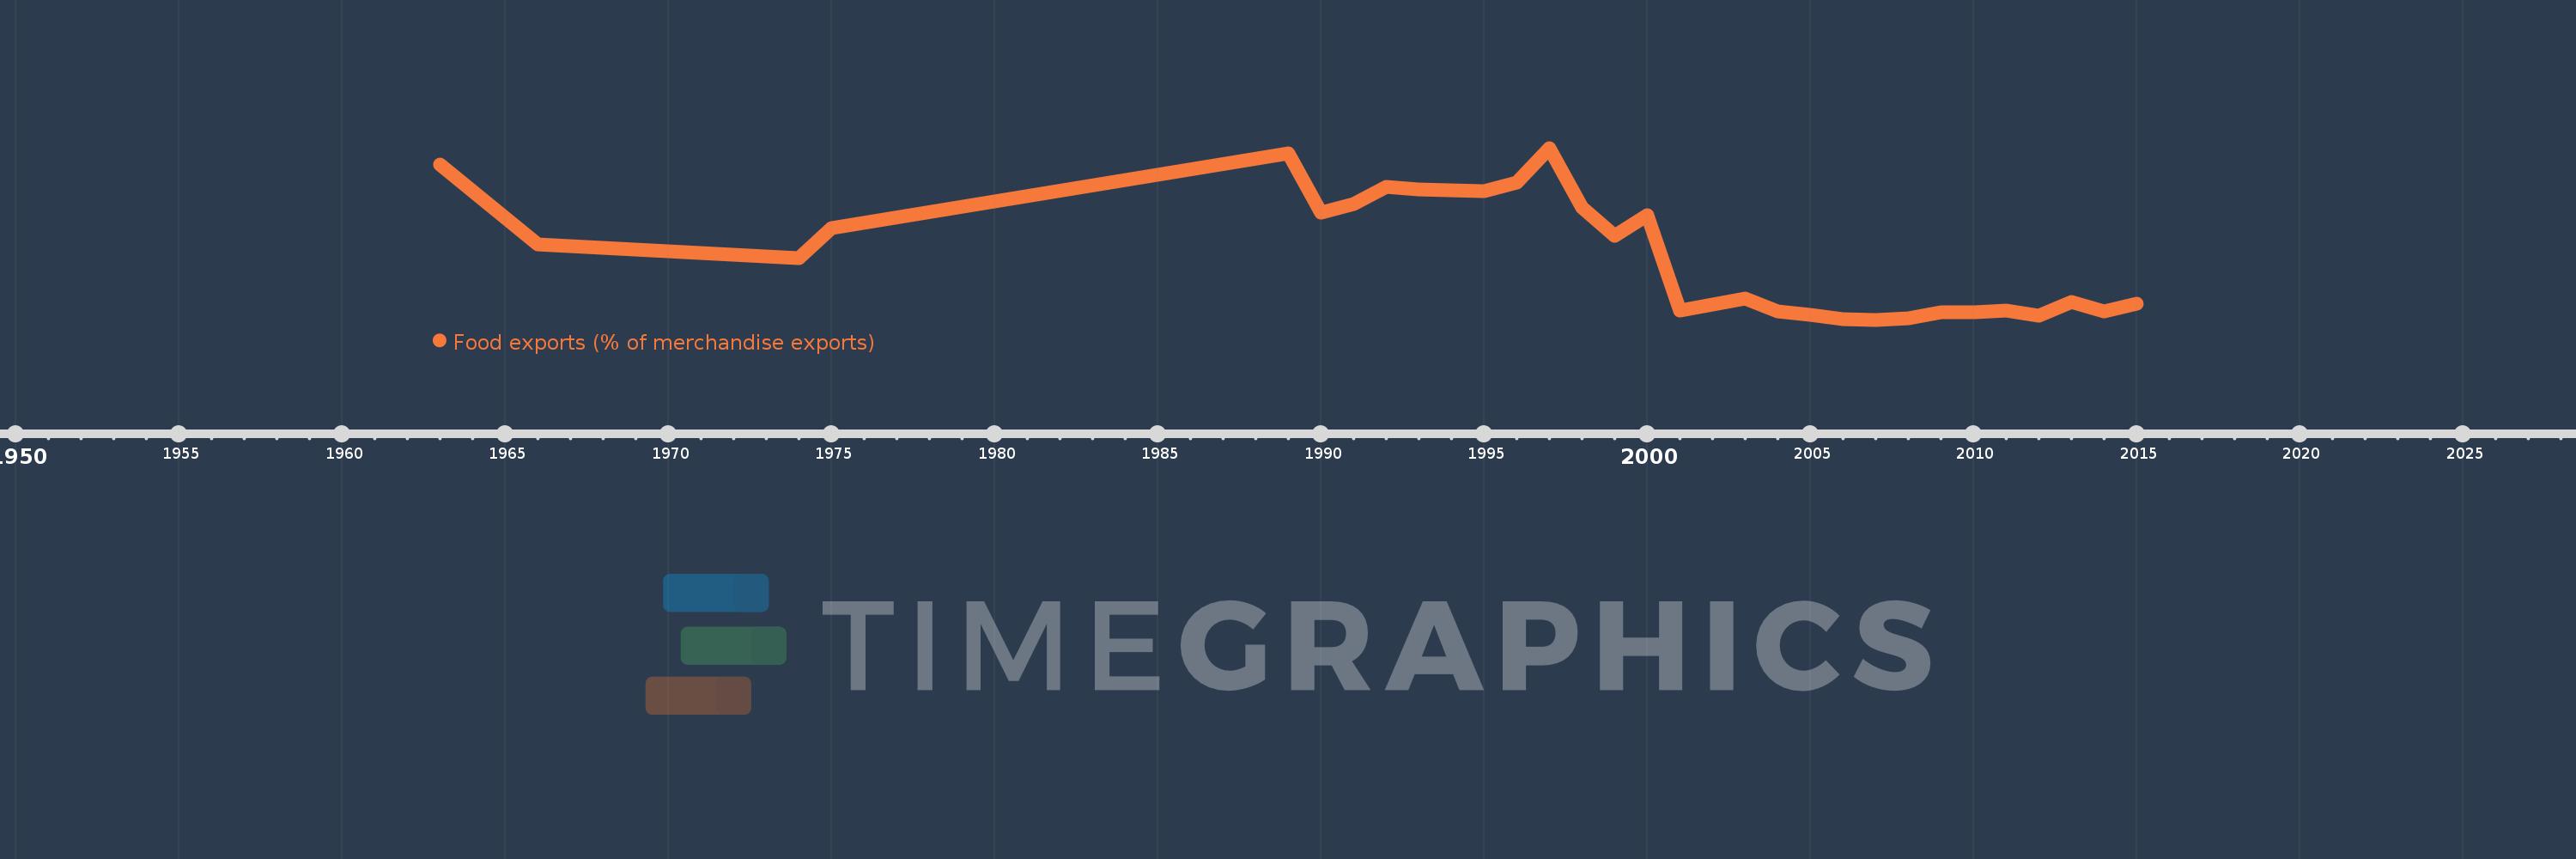
Food exports (% of merchandise exports)
2015,2014,2013,2012,2011,2010,2009,2008,2007,2006,2005,2004,2003,2002,2001,2000,1999,1998,1997,1996,1995,1993,1992,1991,1990,1989,1975,1974,1966,1963
This statistics in other country:
AfghanistanAlbaniaAlgeriaAndorraAngolaAntigua and BarbudaArab WorldArgentinaArmeniaArubaAustraliaAustriaAzerbaijanBahamas, TheBahrainBangladeshBarbadosBelarusBelgiumBelizeBeninBermudaBhutanBoliviaBosnia and HerzegovinaBotswanaBrazilBrunei DarussalamBulgariaBurkina FasoBurundiCabo VerdeCambodiaCameroonCanadaCaribbean small statesCayman IslandsCentral African RepublicCentral Europe and the BalticsChadChileChinaColombiaComorosCongo, Dem. Rep.Congo, Rep.Costa RicaCote d'IvoireCroatiaCubaCyprusCzech RepublicDenmarkDjiboutiDominicaDominican RepublicEarly-demographic dividendEast Asia & PacificEast Asia & Pacific (excluding high income)East Asia & Pacific (IDA & IBRD countries)EcuadorEgypt, Arab Rep.El SalvadorEquatorial GuineaEritreaEstoniaEthiopiaEuro areaEurope & Central AsiaEurope & Central Asia (excluding high income)Europe & Central Asia (IDA & IBRD countries)European UnionFaroe IslandsFijiFinlandFragile and conflict affected situationsFranceFrench PolynesiaGabonGambia, TheGeorgiaGermanyGhanaGreeceGreenlandGrenadaGuatemalaGuineaGuinea-BissauGuyanaHaitiHeavily indebted poor countries (HIPC)High incomeHondurasHong Kong SAR, ChinaHungaryIBRD onlyIcelandIDA & IBRD totalIDA blendIDA onlyIDA totalIndiaIndonesiaIran, Islamic Rep.IraqIrelandIsraelItalyJamaicaJapanJordanKazakhstanKenyaKiribatiKorea, Rep.KuwaitKyrgyz RepublicLao PDRLate-demographic dividendLatin America & Caribbean Latin America & Caribbean (excluding high income)Latin America & the Caribbean (IDA & IBRD countries)LatviaLeast developed countries: UN classificationLebanonLesothoLiberiaLibyaLithuaniaLow & middle incomeLower middle incomeLuxembourgMacao SAR, ChinaMacedonia, FYRMadagascarMalawiMalaysiaMaldivesMaliMaltaMauritaniaMauritiusMexicoMiddle East & North AfricaMiddle East & North Africa (excluding high income)Middle East & North Africa (IDA & IBRD countries)Middle incomeMoldovaMongoliaMoroccoMozambiqueMyanmarNamibiaNepalNetherlandsNew CaledoniaNew ZealandNicaraguaNigerNigeriaNorth AmericaNorwayOECD membersOmanOther small statesPacific island small statesPakistanPalauPanamaPapua New GuineaParaguayPeruPhilippinesPolandPortugalPost-demographic dividendPre-demographic dividendQatarRomaniaRussian FederationRwandaSamoaSao Tome and PrincipeSaudi ArabiaSenegalSerbiaSeychellesSierra LeoneSingaporeSlovak RepublicSloveniaSmall statesSolomon IslandsSomaliaSouth AfricaSouth AsiaSouth Asia (IDA & IBRD)SpainSri LankaSt. Kitts and NevisSt. LuciaSt. Vincent and the GrenadinesSub-Saharan Africa Sub-Saharan Africa (excluding high income)Sub-Saharan Africa (IDA & IBRD countries)SudanSurinameSwazilandSwedenSwitzerlandSyrian Arab RepublicTajikistanTanzaniaThailandTimor-LesteTogoTongaTrinidad and TobagoTunisiaTurkeyTurkmenistanTurks and Caicos IslandsTuvaluUgandaUkraineUnited Arab EmiratesUnited KingdomUnited StatesUpper middle incomeUruguayVanuatuVenezuela, RBVietnamVirgin Islands (U.S.)WorldYemen, Rep.ZambiaZimbabwe Timeline:
This timeline shows a graph from 1963 to 2015 of Suriname. No data until 1962. Number of actual observations by date: 30.
Source name:
World Development Indicators
Source organization:
World Bank staff estimates from the Comtrade database maintained by the United Nations Statistics Division.
Categories, topics:
Private Sector, Trade
Last updated:
apr 23, 2017
Indicators value changes by year
Maximum:
23.191
jan 1, 1997
At the date of observation
Value
Absolute change
Change from previous value
jan 1, 1963
21.115
+21.115
0.0%
jan 1, 1966
10.906
-10.209
-48.35%
jan 1, 1974
9.157
-1.75
-16.04%
jan 1, 1975
12.915
+3.758
41.04%
jan 1, 1989
22.543
+9.628
74.55%
jan 1, 1990
14.948
-7.595
-33.69%
jan 1, 1991
15.985
+1.038
6.94%
jan 1, 1992
18.273
+2.287
14.31%
jan 1, 1993
17.92
-0.352
-1.93%
jan 1, 1995
17.708
-0.212
-1.18%
jan 1, 1996
18.743
+1.035
5.84%
jan 1, 1997
23.191
+4.449
23.74%
jan 1, 1998
15.546
-7.645
-32.96%
jan 1, 1999
11.929
-3.618
-23.27%
jan 1, 2000
14.592
+2.663
22.32%
jan 1, 2001
2.411
-12.18
-83.48%
jan 1, 2002
3.141
+0.73
30.27%
jan 1, 2003
4.005
+0.864
27.5%
jan 1, 2004
2.347
-1.658
-41.41%
jan 1, 2005
1.824
-0.523
-22.28%
jan 1, 2006
1.275
-0.549
-30.09%
jan 1, 2007
1.25
-0.025
-1.96%
jan 1, 2008
1.415
+0.165
13.2%
jan 1, 2009
2.229
+0.814
57.49%
jan 1, 2010
2.18
-0.049
-2.18%
jan 1, 2011
2.379
+0.199
9.12%
jan 1, 2012
1.816
-0.563
-23.67%
jan 1, 2013
3.557
+1.741
95.89%
jan 1, 2014
2.337
-1.219
-34.29%
jan 1, 2015
3.32
+0.983
42.05%
Ranking of countries by current statistics by years


Comments: