29
/
en
AIzaSyAYiBZKx7MnpbEhh9jyipgxe19OcubqV5w
April 1, 2024
264578
Togo
TGO
true
2
1
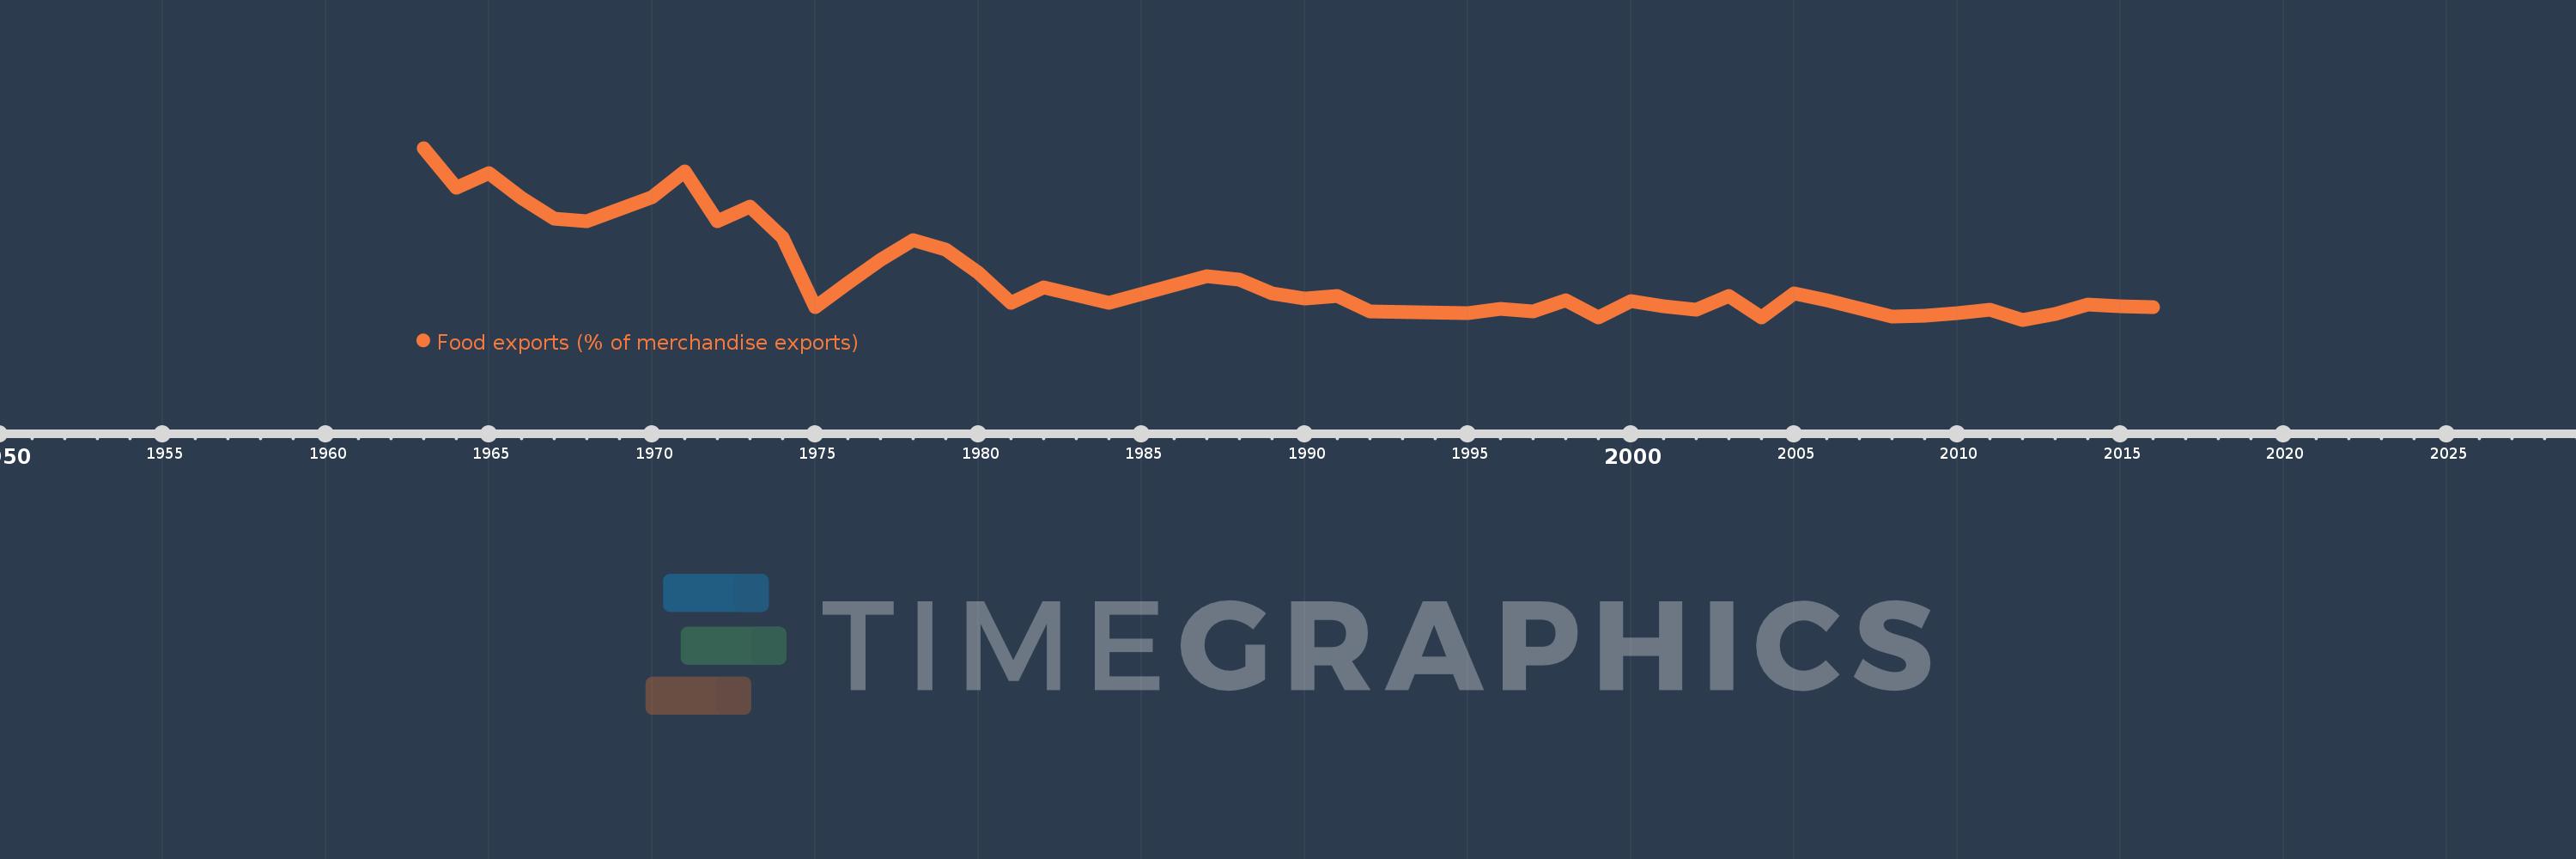
Food exports (% of merchandise exports)
2016,2015,2014,2013,2012,2011,2010,2009,2008,2006,2005,2004,2003,2002,2001,2000,1999,1998,1997,1996,1995,1992,1991,1990,1989,1988,1987,1984,1982,1981,1980,1979,1978,1977,1976,1975,1974,1973,1972,1971,1970,1968,1967,1966,1965,1964,1963
This statistics in other country:
AfghanistanAlbaniaAlgeriaAndorraAngolaAntigua and BarbudaArab WorldArgentinaArmeniaArubaAustraliaAustriaAzerbaijanBahamas, TheBahrainBangladeshBarbadosBelarusBelgiumBelizeBeninBermudaBhutanBoliviaBosnia and HerzegovinaBotswanaBrazilBrunei DarussalamBulgariaBurkina FasoBurundiCabo VerdeCambodiaCameroonCanadaCaribbean small statesCayman IslandsCentral African RepublicCentral Europe and the BalticsChadChileChinaColombiaComorosCongo, Dem. Rep.Congo, Rep.Costa RicaCote d'IvoireCroatiaCubaCyprusCzech RepublicDenmarkDjiboutiDominicaDominican RepublicEarly-demographic dividendEast Asia & PacificEast Asia & Pacific (excluding high income)East Asia & Pacific (IDA & IBRD countries)EcuadorEgypt, Arab Rep.El SalvadorEquatorial GuineaEritreaEstoniaEthiopiaEuro areaEurope & Central AsiaEurope & Central Asia (excluding high income)Europe & Central Asia (IDA & IBRD countries)European UnionFaroe IslandsFijiFinlandFragile and conflict affected situationsFranceFrench PolynesiaGabonGambia, TheGeorgiaGermanyGhanaGreeceGreenlandGrenadaGuatemalaGuineaGuinea-BissauGuyanaHaitiHeavily indebted poor countries (HIPC)High incomeHondurasHong Kong SAR, ChinaHungaryIBRD onlyIcelandIDA & IBRD totalIDA blendIDA onlyIDA totalIndiaIndonesiaIran, Islamic Rep.IraqIrelandIsraelItalyJamaicaJapanJordanKazakhstanKenyaKiribatiKorea, Rep.KuwaitKyrgyz RepublicLao PDRLate-demographic dividendLatin America & Caribbean Latin America & Caribbean (excluding high income)Latin America & the Caribbean (IDA & IBRD countries)LatviaLeast developed countries: UN classificationLebanonLesothoLiberiaLibyaLithuaniaLow & middle incomeLower middle incomeLuxembourgMacao SAR, ChinaMacedonia, FYRMadagascarMalawiMalaysiaMaldivesMaliMaltaMauritaniaMauritiusMexicoMiddle East & North AfricaMiddle East & North Africa (excluding high income)Middle East & North Africa (IDA & IBRD countries)Middle incomeMoldovaMongoliaMoroccoMozambiqueMyanmarNamibiaNepalNetherlandsNew CaledoniaNew ZealandNicaraguaNigerNigeriaNorth AmericaNorwayOECD membersOmanOther small statesPacific island small statesPakistanPalauPanamaPapua New GuineaParaguayPeruPhilippinesPolandPortugalPost-demographic dividendPre-demographic dividendQatarRomaniaRussian FederationRwandaSamoaSao Tome and PrincipeSaudi ArabiaSenegalSerbiaSeychellesSierra LeoneSingaporeSlovak RepublicSloveniaSmall statesSolomon IslandsSomaliaSouth AfricaSouth AsiaSouth Asia (IDA & IBRD)SpainSri LankaSt. Kitts and NevisSt. LuciaSt. Vincent and the GrenadinesSub-Saharan Africa Sub-Saharan Africa (excluding high income)Sub-Saharan Africa (IDA & IBRD countries)SudanSurinameSwazilandSwedenSwitzerlandSyrian Arab RepublicTajikistanTanzaniaThailandTimor-LesteTogoTongaTrinidad and TobagoTunisiaTurkeyTurkmenistanTurks and Caicos IslandsTuvaluUgandaUkraineUnited Arab EmiratesUnited KingdomUnited StatesUpper middle incomeUruguayVanuatuVenezuela, RBVietnamVirgin Islands (U.S.)WorldYemen, Rep.ZambiaZimbabwe Timeline:
This timeline shows a graph from 1963 to 2016 of Togo. No data until 1962. Number of actual observations by date: 47.
Source name:
World Development Indicators
Source organization:
World Bank staff estimates from the Comtrade database maintained by the United Nations Statistics Division.
Categories, topics:
Private Sector, Trade
Last updated:
apr 23, 2017
Indicators value changes by year
Minimum:
14.693
jan 1, 2012
Maximum:
75.368
jan 1, 1963
At the date of observation
Value
Absolute change
Change from previous value
jan 1, 1963
75.368
+75.368
0.0%
jan 1, 1964
61.411
-13.957
-18.52%
jan 1, 1965
66.544
+5.132
8.36%
jan 1, 1966
57.666
-8.877
-13.34%
jan 1, 1967
50.307
-7.359
-12.76%
jan 1, 1968
49.413
-0.894
-1.78%
jan 1, 1970
58.07
+8.656
17.52%
jan 1, 1971
67.197
+9.127
15.72%
jan 1, 1972
49.532
-17.666
-26.29%
jan 1, 1973
54.521
+4.99
10.07%
jan 1, 1974
43.718
-10.804
-19.82%
jan 1, 1975
19.199
-24.519
-56.08%
jan 1, 1976
27.682
+8.483
44.18%
jan 1, 1977
35.769
+8.087
29.21%
jan 1, 1978
42.933
+7.164
20.03%
jan 1, 1979
39.589
-3.344
-7.79%
jan 1, 1980
31.316
-8.273
-20.9%
jan 1, 1981
20.669
-10.648
-34.0%
jan 1, 1982
26.139
+5.47
26.47%
jan 1, 1984
20.616
-5.523
-21.13%
jan 1, 1987
30.094
+9.478
45.98%
jan 1, 1988
28.873
-1.22
-4.05%
jan 1, 1989
24.092
-4.782
-16.56%
jan 1, 1990
22.125
-1.966
-8.16%
jan 1, 1991
22.958
+0.833
3.77%
jan 1, 1992
17.711
-5.248
-22.86%
jan 1, 1995
17.065
-0.645
-3.64%
jan 1, 1996
18.546
+1.481
8.68%
jan 1, 1997
17.671
-0.875
-4.72%
jan 1, 1998
21.704
+4.033
22.82%
jan 1, 1999
15.41
-6.295
-29.0%
jan 1, 2000
21.26
+5.851
37.97%
jan 1, 2001
19.58
-1.68
-7.9%
jan 1, 2002
18.231
-1.349
-6.89%
jan 1, 2003
23.229
+4.998
27.42%
jan 1, 2004
15.495
-7.735
-33.3%
jan 1, 2005
23.968
+8.474
54.69%
jan 1, 2006
21.45
-2.518
-10.51%
jan 1, 2008
15.723
-5.727
-26.7%
jan 1, 2009
15.998
+0.274
1.75%
jan 1, 2010
16.879
+0.881
5.51%
jan 1, 2011
18.109
+1.23
7.29%
jan 1, 2012
14.693
-3.416
-18.86%
jan 1, 2013
16.603
+1.909
13.0%
jan 1, 2014
20.071
+3.468
20.89%
jan 1, 2015
19.307
-0.764
-3.81%
jan 1, 2016
19.221
-0.087
-0.45%
Ranking of countries by current statistics by years


Comments: