29
/
en
AIzaSyAYiBZKx7MnpbEhh9jyipgxe19OcubqV5w
April 1, 2024
78220
Bangladesh
BGD
true
2
1
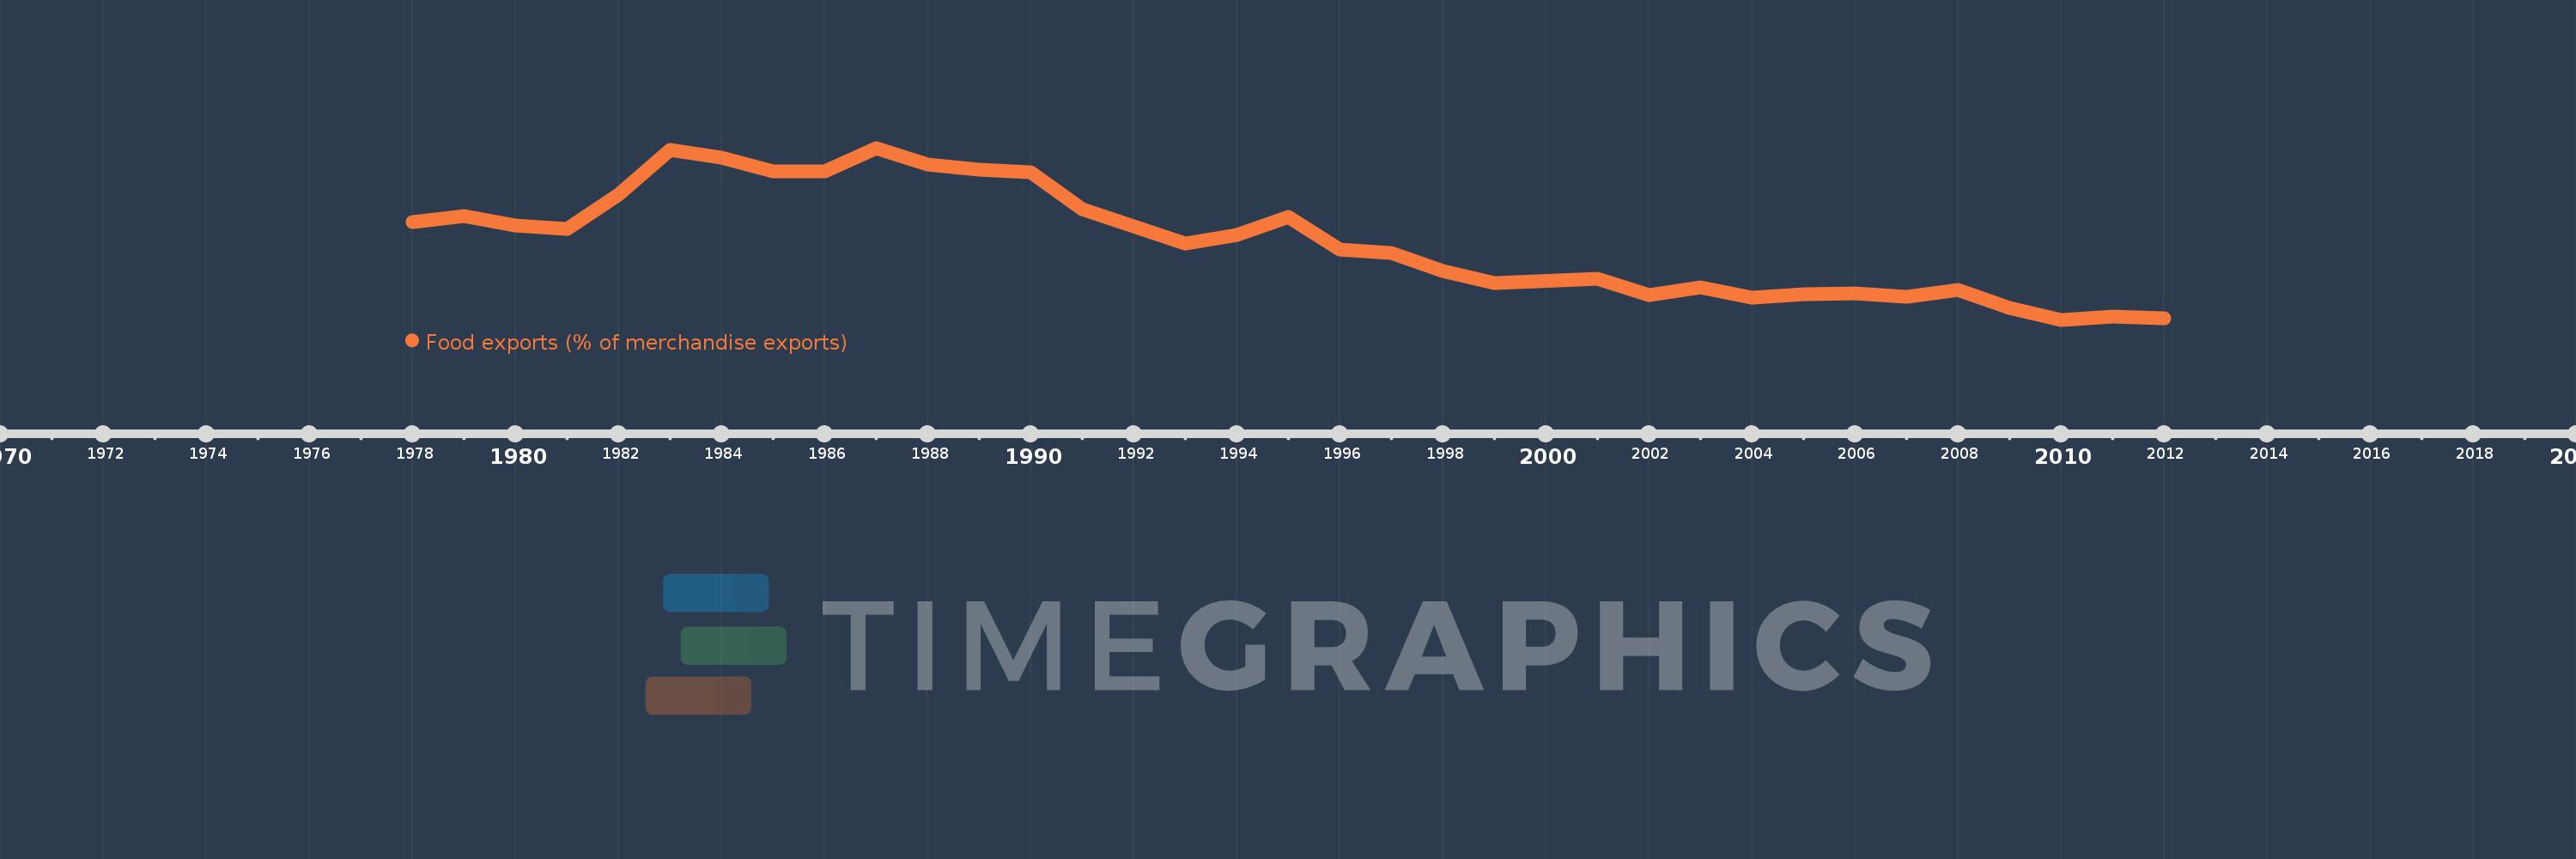
Food exports (% of merchandise exports)
2012,2011,2010,2009,2008,2007,2006,2005,2004,2003,2002,2001,1999,1998,1997,1996,1995,1994,1993,1992,1991,1990,1989,1988,1987,1986,1985,1984,1983,1982,1981,1980,1979,1978
This statistics in other country:
AfghanistanAlbaniaAlgeriaAndorraAngolaAntigua and BarbudaArab WorldArgentinaArmeniaArubaAustraliaAustriaAzerbaijanBahamas, TheBahrainBangladeshBarbadosBelarusBelgiumBelizeBeninBermudaBhutanBoliviaBosnia and HerzegovinaBotswanaBrazilBrunei DarussalamBulgariaBurkina FasoBurundiCabo VerdeCambodiaCameroonCanadaCaribbean small statesCayman IslandsCentral African RepublicCentral Europe and the BalticsChadChileChinaColombiaComorosCongo, Dem. Rep.Congo, Rep.Costa RicaCote d'IvoireCroatiaCubaCyprusCzech RepublicDenmarkDjiboutiDominicaDominican RepublicEarly-demographic dividendEast Asia & PacificEast Asia & Pacific (excluding high income)East Asia & Pacific (IDA & IBRD countries)EcuadorEgypt, Arab Rep.El SalvadorEquatorial GuineaEritreaEstoniaEthiopiaEuro areaEurope & Central AsiaEurope & Central Asia (excluding high income)Europe & Central Asia (IDA & IBRD countries)European UnionFaroe IslandsFijiFinlandFragile and conflict affected situationsFranceFrench PolynesiaGabonGambia, TheGeorgiaGermanyGhanaGreeceGreenlandGrenadaGuatemalaGuineaGuinea-BissauGuyanaHaitiHeavily indebted poor countries (HIPC)High incomeHondurasHong Kong SAR, ChinaHungaryIBRD onlyIcelandIDA & IBRD totalIDA blendIDA onlyIDA totalIndiaIndonesiaIran, Islamic Rep.IraqIrelandIsraelItalyJamaicaJapanJordanKazakhstanKenyaKiribatiKorea, Rep.KuwaitKyrgyz RepublicLao PDRLate-demographic dividendLatin America & Caribbean Latin America & Caribbean (excluding high income)Latin America & the Caribbean (IDA & IBRD countries)LatviaLeast developed countries: UN classificationLebanonLesothoLiberiaLibyaLithuaniaLow & middle incomeLower middle incomeLuxembourgMacao SAR, ChinaMacedonia, FYRMadagascarMalawiMalaysiaMaldivesMaliMaltaMauritaniaMauritiusMexicoMiddle East & North AfricaMiddle East & North Africa (excluding high income)Middle East & North Africa (IDA & IBRD countries)Middle incomeMoldovaMongoliaMoroccoMozambiqueMyanmarNamibiaNepalNetherlandsNew CaledoniaNew ZealandNicaraguaNigerNigeriaNorth AmericaNorwayOECD membersOmanOther small statesPacific island small statesPakistanPalauPanamaPapua New GuineaParaguayPeruPhilippinesPolandPortugalPost-demographic dividendPre-demographic dividendQatarRomaniaRussian FederationRwandaSamoaSao Tome and PrincipeSaudi ArabiaSenegalSerbiaSeychellesSierra LeoneSingaporeSlovak RepublicSloveniaSmall statesSolomon IslandsSomaliaSouth AfricaSouth AsiaSouth Asia (IDA & IBRD)SpainSri LankaSt. Kitts and NevisSt. LuciaSt. Vincent and the GrenadinesSub-Saharan Africa Sub-Saharan Africa (excluding high income)Sub-Saharan Africa (IDA & IBRD countries)SudanSurinameSwazilandSwedenSwitzerlandSyrian Arab RepublicTajikistanTanzaniaThailandTimor-LesteTogoTongaTrinidad and TobagoTunisiaTurkeyTurkmenistanTurks and Caicos IslandsTuvaluUgandaUkraineUnited Arab EmiratesUnited KingdomUnited StatesUpper middle incomeUruguayVanuatuVenezuela, RBVietnamVirgin Islands (U.S.)WorldYemen, Rep.ZambiaZimbabwe Timeline:
This timeline shows a graph from 1978 to 2012 of Bangladesh. No data until 1977. Number of actual observations by date: 34.
Source name:
World Development Indicators
Source organization:
World Bank staff estimates from the Comtrade database maintained by the United Nations Statistics Division.
Categories, topics:
Private Sector, Trade
Last updated:
apr 23, 2017
Indicators value changes by year
Maximum:
20.196
jan 1, 1987
At the date of observation
Value
Absolute change
Change from previous value
jan 1, 1978
13.047
+13.047
0.0%
jan 1, 1979
13.683
+0.636
4.88%
jan 1, 1980
12.721
-0.962
-7.03%
jan 1, 1981
12.451
-0.27
-2.12%
jan 1, 1982
15.696
+3.245
26.06%
jan 1, 1983
19.97
+4.274
27.23%
jan 1, 1984
19.282
-0.688
-3.45%
jan 1, 1985
17.983
-1.299
-6.73%
jan 1, 1986
17.919
-0.065
-0.36%
jan 1, 1987
20.196
+2.277
12.71%
jan 1, 1988
18.641
-1.555
-7.7%
jan 1, 1989
18.138
-0.503
-2.7%
jan 1, 1990
17.836
-0.301
-1.66%
jan 1, 1991
14.314
-3.522
-19.75%
jan 1, 1992
12.641
-1.673
-11.69%
jan 1, 1993
11.026
-1.615
-12.78%
jan 1, 1994
11.812
+0.787
7.13%
jan 1, 1995
13.565
+1.753
14.84%
jan 1, 1996
10.449
-3.116
-22.97%
jan 1, 1997
10.085
-0.363
-3.48%
jan 1, 1998
8.357
-1.728
-17.13%
jan 1, 1999
7.23
-1.128
-13.49%
jan 1, 2001
7.609
+0.379
5.24%
jan 1, 2002
6.067
-1.542
-20.26%
jan 1, 2003
6.808
+0.742
12.22%
jan 1, 2004
5.788
-1.02
-14.99%
jan 1, 2005
6.184
+0.396
6.84%
jan 1, 2006
6.222
+0.038
0.61%
jan 1, 2007
5.928
-0.294
-4.72%
jan 1, 2008
6.52
+0.592
9.98%
jan 1, 2009
4.819
-1.701
-26.09%
jan 1, 2010
3.695
-1.124
-23.33%
jan 1, 2011
4.03
+0.335
9.06%
jan 1, 2012
3.86
-0.17
-4.21%
Ranking of countries by current statistics by years


Comments: