29
/
en
AIzaSyAYiBZKx7MnpbEhh9jyipgxe19OcubqV5w
April 1, 2024
134084
France
FRA
true
2
1
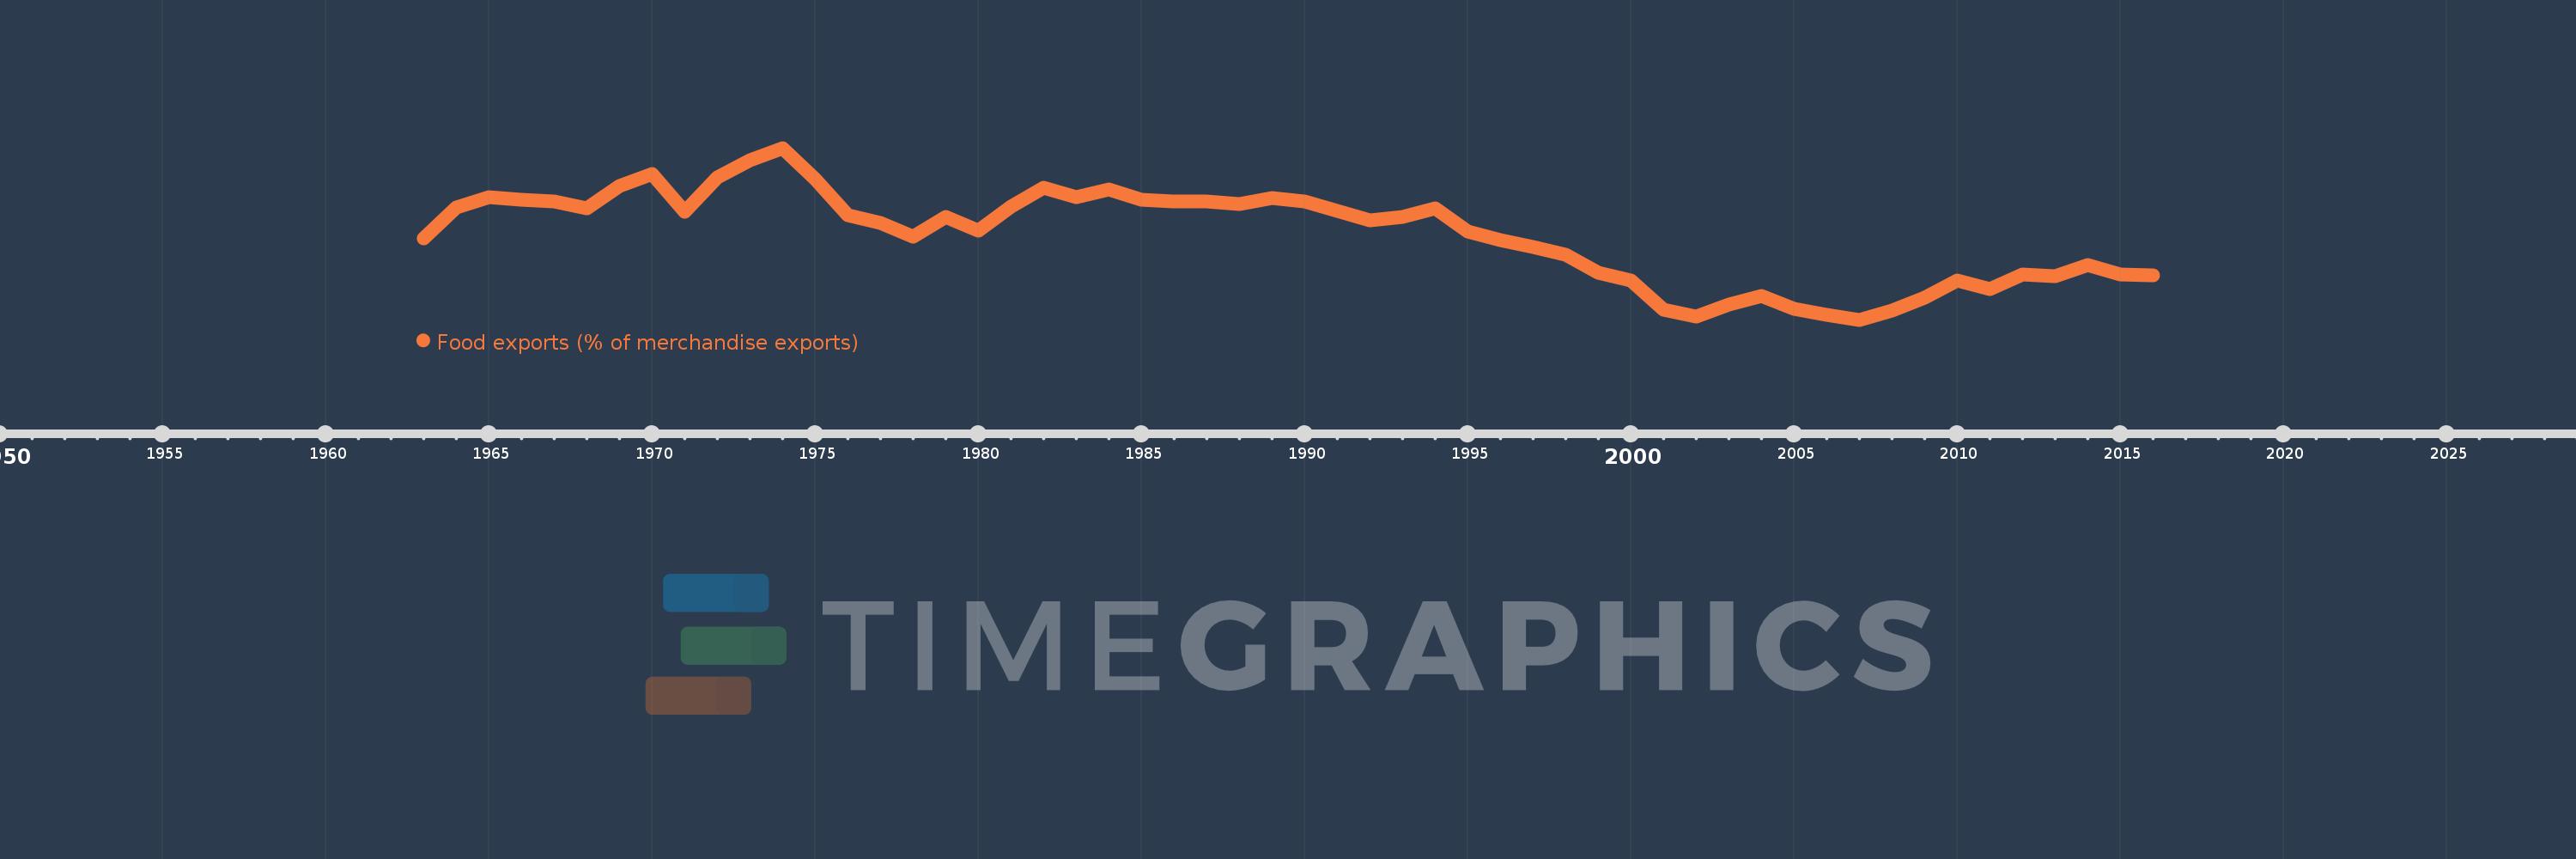
Food exports (% of merchandise exports)
2016,2015,2014,2013,2012,2011,2010,2009,2008,2007,2006,2005,2004,2003,2002,2001,2000,1999,1998,1997,1996,1995,1994,1993,1992,1991,1990,1989,1988,1987,1986,1985,1984,1983,1982,1981,1980,1979,1978,1977,1976,1975,1974,1973,1972,1971,1970,1969,1968,1967,1966,1965,1964,1963
This statistics in other country:
AfghanistanAlbaniaAlgeriaAndorraAngolaAntigua and BarbudaArab WorldArgentinaArmeniaArubaAustraliaAustriaAzerbaijanBahamas, TheBahrainBangladeshBarbadosBelarusBelgiumBelizeBeninBermudaBhutanBoliviaBosnia and HerzegovinaBotswanaBrazilBrunei DarussalamBulgariaBurkina FasoBurundiCabo VerdeCambodiaCameroonCanadaCaribbean small statesCayman IslandsCentral African RepublicCentral Europe and the BalticsChadChileChinaColombiaComorosCongo, Dem. Rep.Congo, Rep.Costa RicaCote d'IvoireCroatiaCubaCyprusCzech RepublicDenmarkDjiboutiDominicaDominican RepublicEarly-demographic dividendEast Asia & PacificEast Asia & Pacific (excluding high income)East Asia & Pacific (IDA & IBRD countries)EcuadorEgypt, Arab Rep.El SalvadorEquatorial GuineaEritreaEstoniaEthiopiaEuro areaEurope & Central AsiaEurope & Central Asia (excluding high income)Europe & Central Asia (IDA & IBRD countries)European UnionFaroe IslandsFijiFinlandFragile and conflict affected situationsFranceFrench PolynesiaGabonGambia, TheGeorgiaGermanyGhanaGreeceGreenlandGrenadaGuatemalaGuineaGuinea-BissauGuyanaHaitiHeavily indebted poor countries (HIPC)High incomeHondurasHong Kong SAR, ChinaHungaryIBRD onlyIcelandIDA & IBRD totalIDA blendIDA onlyIDA totalIndiaIndonesiaIran, Islamic Rep.IraqIrelandIsraelItalyJamaicaJapanJordanKazakhstanKenyaKiribatiKorea, Rep.KuwaitKyrgyz RepublicLao PDRLate-demographic dividendLatin America & Caribbean Latin America & Caribbean (excluding high income)Latin America & the Caribbean (IDA & IBRD countries)LatviaLeast developed countries: UN classificationLebanonLesothoLiberiaLibyaLithuaniaLow & middle incomeLower middle incomeLuxembourgMacao SAR, ChinaMacedonia, FYRMadagascarMalawiMalaysiaMaldivesMaliMaltaMauritaniaMauritiusMexicoMiddle East & North AfricaMiddle East & North Africa (excluding high income)Middle East & North Africa (IDA & IBRD countries)Middle incomeMoldovaMongoliaMoroccoMozambiqueMyanmarNamibiaNepalNetherlandsNew CaledoniaNew ZealandNicaraguaNigerNigeriaNorth AmericaNorwayOECD membersOmanOther small statesPacific island small statesPakistanPalauPanamaPapua New GuineaParaguayPeruPhilippinesPolandPortugalPost-demographic dividendPre-demographic dividendQatarRomaniaRussian FederationRwandaSamoaSao Tome and PrincipeSaudi ArabiaSenegalSerbiaSeychellesSierra LeoneSingaporeSlovak RepublicSloveniaSmall statesSolomon IslandsSomaliaSouth AfricaSouth AsiaSouth Asia (IDA & IBRD)SpainSri LankaSt. Kitts and NevisSt. LuciaSt. Vincent and the GrenadinesSub-Saharan Africa Sub-Saharan Africa (excluding high income)Sub-Saharan Africa (IDA & IBRD countries)SudanSurinameSwazilandSwedenSwitzerlandSyrian Arab RepublicTajikistanTanzaniaThailandTimor-LesteTogoTongaTrinidad and TobagoTunisiaTurkeyTurkmenistanTurks and Caicos IslandsTuvaluUgandaUkraineUnited Arab EmiratesUnited KingdomUnited StatesUpper middle incomeUruguayVanuatuVenezuela, RBVietnamVirgin Islands (U.S.)WorldYemen, Rep.ZambiaZimbabwe Timeline:
This timeline shows a graph from 1963 to 2016 of France. No data until 1962. Number of actual observations by date: 54.
Source name:
World Development Indicators
Source organization:
World Bank staff estimates from the Comtrade database maintained by the United Nations Statistics Division.
Categories, topics:
Private Sector, Trade
Last updated:
apr 23, 2017
Indicators value changes by year
Minimum:
10.449
jan 1, 2007
Maximum:
18.953
jan 1, 1974
At the date of observation
Value
Absolute change
Change from previous value
jan 1, 1963
14.464
+14.464
0.0%
jan 1, 1964
15.992
+1.529
10.57%
jan 1, 1965
16.496
+0.503
3.15%
jan 1, 1966
16.384
-0.112
-0.68%
jan 1, 1967
16.284
-0.1
-0.61%
jan 1, 1968
15.966
-0.318
-1.95%
jan 1, 1969
17.082
+1.116
6.99%
jan 1, 1970
17.651
+0.569
3.33%
jan 1, 1971
15.803
-1.848
-10.47%
jan 1, 1972
17.512
+1.709
10.81%
jan 1, 1973
18.34
+0.828
4.73%
jan 1, 1974
18.953
+0.612
3.34%
jan 1, 1975
17.408
-1.545
-8.15%
jan 1, 1976
15.636
-1.771
-10.18%
jan 1, 1977
15.256
-0.381
-2.43%
jan 1, 1978
14.571
-0.685
-4.49%
jan 1, 1979
15.551
+0.98
6.73%
jan 1, 1980
14.841
-0.711
-4.57%
jan 1, 1981
16.052
+1.211
8.16%
jan 1, 1982
17.004
+0.952
5.93%
jan 1, 1983
16.5
-0.504
-2.96%
jan 1, 1984
16.913
+0.412
2.5%
jan 1, 1985
16.391
-0.522
-3.08%
jan 1, 1986
16.318
-0.073
-0.45%
jan 1, 1987
16.298
-0.02
-0.12%
jan 1, 1988
16.177
-0.121
-0.74%
jan 1, 1989
16.454
+0.278
1.72%
jan 1, 1990
16.284
-0.17
-1.03%
jan 1, 1991
15.837
-0.447
-2.75%
jan 1, 1992
15.349
-0.488
-3.08%
jan 1, 1993
15.551
+0.202
1.32%
jan 1, 1994
15.958
+0.406
2.61%
jan 1, 1995
14.835
-1.122
-7.03%
jan 1, 1996
14.378
-0.457
-3.08%
jan 1, 1997
14.033
-0.345
-2.4%
jan 1, 1998
13.651
-0.382
-2.72%
jan 1, 1999
12.758
-0.893
-6.54%
jan 1, 2000
12.412
-0.346
-2.71%
jan 1, 2001
10.962
-1.45
-11.68%
jan 1, 2002
10.624
-0.338
-3.09%
jan 1, 2003
11.22
+0.596
5.61%
jan 1, 2004
11.611
+0.391
3.49%
jan 1, 2005
11.005
-0.606
-5.22%
jan 1, 2006
10.694
-0.31
-2.82%
jan 1, 2007
10.449
-0.245
-2.29%
jan 1, 2008
10.907
+0.458
4.39%
jan 1, 2009
11.557
+0.649
5.95%
jan 1, 2010
12.396
+0.839
7.26%
jan 1, 2011
11.974
-0.422
-3.4%
jan 1, 2012
12.691
+0.718
5.99%
jan 1, 2013
12.612
-0.08
-0.63%
jan 1, 2014
13.17
+0.559
4.43%
jan 1, 2015
12.669
-0.501
-3.8%
jan 1, 2016
12.645
-0.024
-0.19%
Ranking of countries by current statistics by years


Comments: