29
/
en
AIzaSyAYiBZKx7MnpbEhh9jyipgxe19OcubqV5w
April 1, 2024
191379
Malta
MLT
true
2
1
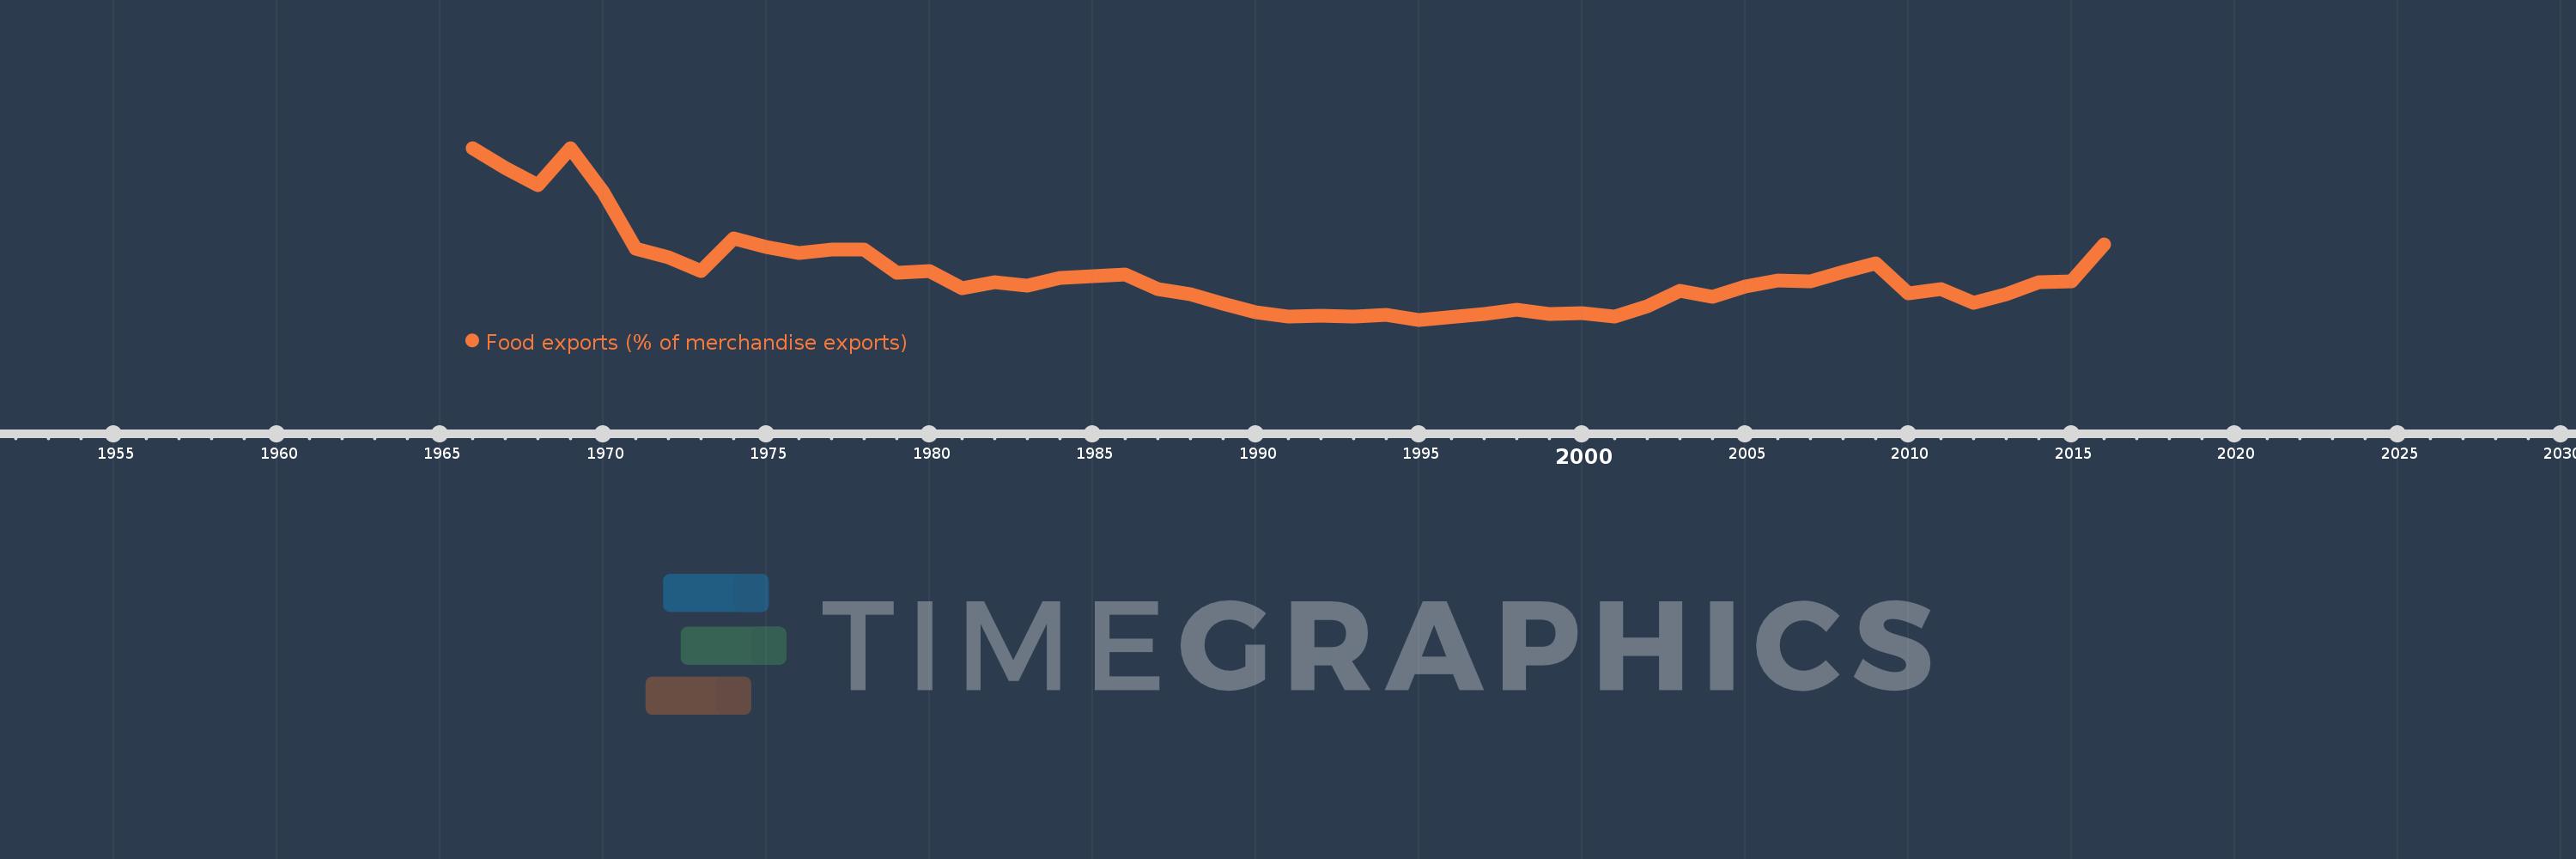
Food exports (% of merchandise exports)
2016,2015,2014,2013,2012,2011,2010,2009,2008,2007,2006,2005,2004,2003,2002,2001,2000,1999,1998,1997,1995,1994,1993,1992,1991,1990,1989,1988,1987,1986,1985,1984,1983,1982,1981,1980,1979,1978,1977,1976,1975,1974,1973,1972,1971,1970,1969,1968,1967,1966
This statistics in other country:
AfghanistanAlbaniaAlgeriaAndorraAngolaAntigua and BarbudaArab WorldArgentinaArmeniaArubaAustraliaAustriaAzerbaijanBahamas, TheBahrainBangladeshBarbadosBelarusBelgiumBelizeBeninBermudaBhutanBoliviaBosnia and HerzegovinaBotswanaBrazilBrunei DarussalamBulgariaBurkina FasoBurundiCabo VerdeCambodiaCameroonCanadaCaribbean small statesCayman IslandsCentral African RepublicCentral Europe and the BalticsChadChileChinaColombiaComorosCongo, Dem. Rep.Congo, Rep.Costa RicaCote d'IvoireCroatiaCubaCyprusCzech RepublicDenmarkDjiboutiDominicaDominican RepublicEarly-demographic dividendEast Asia & PacificEast Asia & Pacific (excluding high income)East Asia & Pacific (IDA & IBRD countries)EcuadorEgypt, Arab Rep.El SalvadorEquatorial GuineaEritreaEstoniaEthiopiaEuro areaEurope & Central AsiaEurope & Central Asia (excluding high income)Europe & Central Asia (IDA & IBRD countries)European UnionFaroe IslandsFijiFinlandFragile and conflict affected situationsFranceFrench PolynesiaGabonGambia, TheGeorgiaGermanyGhanaGreeceGreenlandGrenadaGuatemalaGuineaGuinea-BissauGuyanaHaitiHeavily indebted poor countries (HIPC)High incomeHondurasHong Kong SAR, ChinaHungaryIBRD onlyIcelandIDA & IBRD totalIDA blendIDA onlyIDA totalIndiaIndonesiaIran, Islamic Rep.IraqIrelandIsraelItalyJamaicaJapanJordanKazakhstanKenyaKiribatiKorea, Rep.KuwaitKyrgyz RepublicLao PDRLate-demographic dividendLatin America & Caribbean Latin America & Caribbean (excluding high income)Latin America & the Caribbean (IDA & IBRD countries)LatviaLeast developed countries: UN classificationLebanonLesothoLiberiaLibyaLithuaniaLow & middle incomeLower middle incomeLuxembourgMacao SAR, ChinaMacedonia, FYRMadagascarMalawiMalaysiaMaldivesMaliMaltaMauritaniaMauritiusMexicoMiddle East & North AfricaMiddle East & North Africa (excluding high income)Middle East & North Africa (IDA & IBRD countries)Middle incomeMoldovaMongoliaMoroccoMozambiqueMyanmarNamibiaNepalNetherlandsNew CaledoniaNew ZealandNicaraguaNigerNigeriaNorth AmericaNorwayOECD membersOmanOther small statesPacific island small statesPakistanPalauPanamaPapua New GuineaParaguayPeruPhilippinesPolandPortugalPost-demographic dividendPre-demographic dividendQatarRomaniaRussian FederationRwandaSamoaSao Tome and PrincipeSaudi ArabiaSenegalSerbiaSeychellesSierra LeoneSingaporeSlovak RepublicSloveniaSmall statesSolomon IslandsSomaliaSouth AfricaSouth AsiaSouth Asia (IDA & IBRD)SpainSri LankaSt. Kitts and NevisSt. LuciaSt. Vincent and the GrenadinesSub-Saharan Africa Sub-Saharan Africa (excluding high income)Sub-Saharan Africa (IDA & IBRD countries)SudanSurinameSwazilandSwedenSwitzerlandSyrian Arab RepublicTajikistanTanzaniaThailandTimor-LesteTogoTongaTrinidad and TobagoTunisiaTurkeyTurkmenistanTurks and Caicos IslandsTuvaluUgandaUkraineUnited Arab EmiratesUnited KingdomUnited StatesUpper middle incomeUruguayVanuatuVenezuela, RBVietnamVirgin Islands (U.S.)WorldYemen, Rep.ZambiaZimbabwe Timeline:
This timeline shows a graph from 1966 to 2016 of Malta. No data until 1965. Number of actual observations by date: 50.
Source name:
World Development Indicators
Source organization:
World Bank staff estimates from the Comtrade database maintained by the United Nations Statistics Division.
Categories, topics:
Private Sector, Trade
Last updated:
apr 23, 2017
Indicators value changes by year
Maximum:
21.215
jan 1, 1969
At the date of observation
Value
Absolute change
Change from previous value
jan 1, 1966
21.2
+21.2
0.0%
jan 1, 1967
18.95
-2.25
-10.61%
jan 1, 1968
17.016
-1.934
-10.21%
jan 1, 1969
21.215
+4.199
24.68%
jan 1, 1970
16.216
-4.999
-23.56%
jan 1, 1971
9.838
-6.378
-39.33%
jan 1, 1972
8.817
-1.021
-10.38%
jan 1, 1973
7.238
-1.579
-17.91%
jan 1, 1974
10.942
+3.704
51.18%
jan 1, 1975
9.943
-0.999
-9.13%
jan 1, 1976
9.343
-0.6
-6.04%
jan 1, 1977
9.677
+0.335
3.58%
jan 1, 1978
9.675
-0.002
-0.02%
jan 1, 1979
7.028
-2.647
-27.36%
jan 1, 1980
7.308
+0.28
3.99%
jan 1, 1981
5.329
-1.979
-27.08%
jan 1, 1982
5.967
+0.638
11.97%
jan 1, 1983
5.629
-0.338
-5.66%
jan 1, 1984
6.436
+0.806
14.33%
jan 1, 1985
6.658
+0.223
3.46%
jan 1, 1986
6.873
+0.215
3.23%
jan 1, 1987
5.228
-1.645
-23.93%
jan 1, 1988
4.604
-0.624
-11.94%
jan 1, 1989
3.518
-1.086
-23.59%
jan 1, 1990
2.623
-0.895
-25.44%
jan 1, 1991
2.14
-0.483
-18.42%
jan 1, 1992
2.184
+0.045
2.08%
jan 1, 1993
2.144
-0.041
-1.86%
jan 1, 1994
2.337
+0.193
9.0%
jan 1, 1995
1.743
-0.594
-25.42%
jan 1, 1997
2.434
+0.691
39.65%
jan 1, 1998
2.927
+0.493
20.27%
jan 1, 1999
2.352
-0.575
-19.65%
jan 1, 2000
2.47
+0.118
5.03%
jan 1, 2001
2.114
-0.356
-14.43%
jan 1, 2002
3.298
+1.184
56.04%
jan 1, 2003
5.053
+1.755
53.21%
jan 1, 2004
4.301
-0.752
-14.88%
jan 1, 2005
5.55
+1.249
29.04%
jan 1, 2006
6.158
+0.608
10.95%
jan 1, 2007
6.111
-0.046
-0.75%
jan 1, 2008
7.208
+1.096
17.94%
jan 1, 2009
8.125
+0.918
12.73%
jan 1, 2010
4.684
-3.441
-42.35%
jan 1, 2011
5.214
+0.53
11.31%
jan 1, 2012
3.673
-1.541
-29.56%
jan 1, 2013
4.669
+0.996
27.11%
jan 1, 2014
5.951
+1.283
27.47%
jan 1, 2015
6.07
+0.119
2.0%
jan 1, 2016
10.268
+4.198
69.15%
Ranking of countries by current statistics by years


Comments: