29
/
en
AIzaSyAYiBZKx7MnpbEhh9jyipgxe19OcubqV5w
April 1, 2024
107223
Colombia
COL
true
2
1
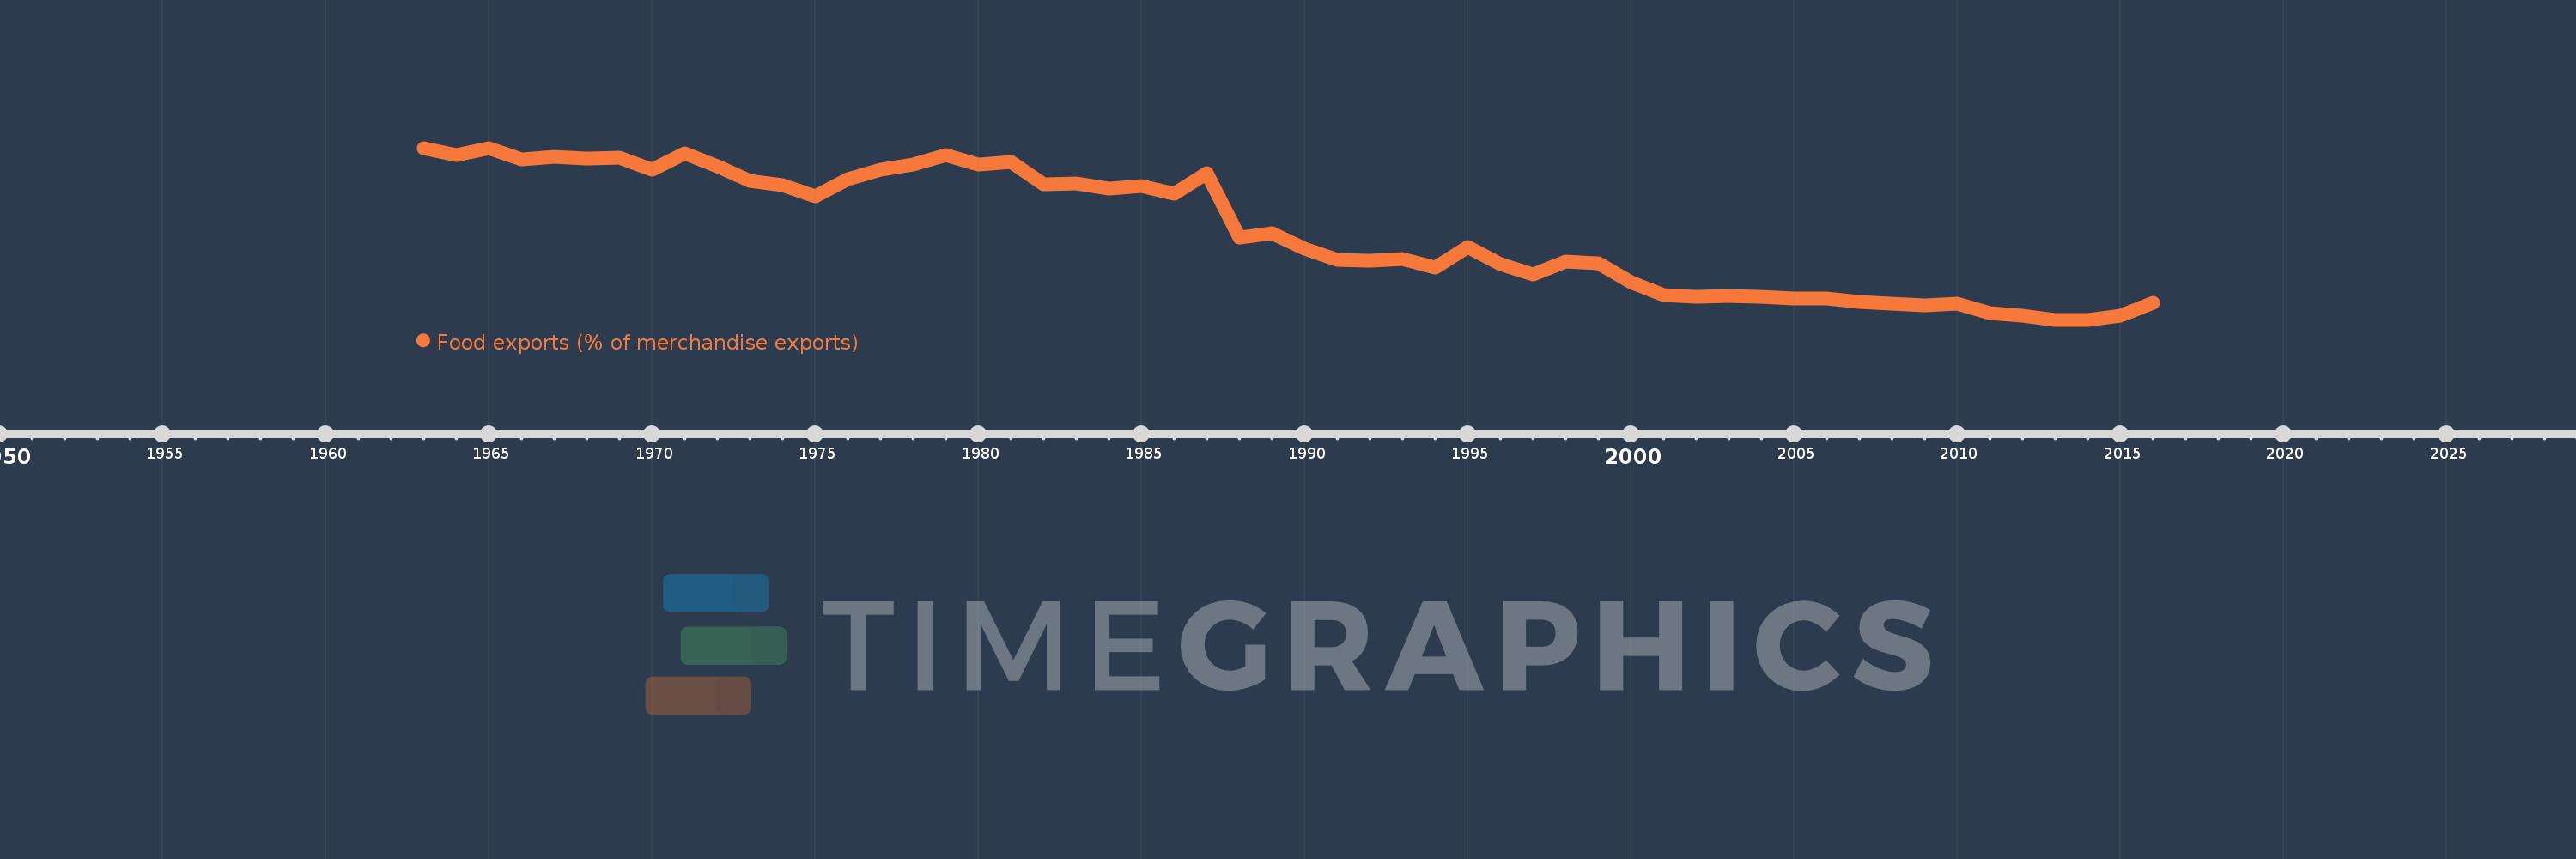
Food exports (% of merchandise exports)
2016,2015,2014,2013,2012,2011,2010,2009,2008,2007,2006,2005,2004,2003,2002,2001,2000,1999,1998,1997,1996,1995,1994,1993,1992,1991,1990,1989,1988,1987,1986,1985,1984,1983,1982,1981,1980,1979,1978,1977,1976,1975,1974,1973,1972,1971,1970,1969,1968,1967,1966,1965,1964,1963
This statistics in other country:
AfghanistanAlbaniaAlgeriaAndorraAngolaAntigua and BarbudaArab WorldArgentinaArmeniaArubaAustraliaAustriaAzerbaijanBahamas, TheBahrainBangladeshBarbadosBelarusBelgiumBelizeBeninBermudaBhutanBoliviaBosnia and HerzegovinaBotswanaBrazilBrunei DarussalamBulgariaBurkina FasoBurundiCabo VerdeCambodiaCameroonCanadaCaribbean small statesCayman IslandsCentral African RepublicCentral Europe and the BalticsChadChileChinaColombiaComorosCongo, Dem. Rep.Congo, Rep.Costa RicaCote d'IvoireCroatiaCubaCyprusCzech RepublicDenmarkDjiboutiDominicaDominican RepublicEarly-demographic dividendEast Asia & PacificEast Asia & Pacific (excluding high income)East Asia & Pacific (IDA & IBRD countries)EcuadorEgypt, Arab Rep.El SalvadorEquatorial GuineaEritreaEstoniaEthiopiaEuro areaEurope & Central AsiaEurope & Central Asia (excluding high income)Europe & Central Asia (IDA & IBRD countries)European UnionFaroe IslandsFijiFinlandFragile and conflict affected situationsFranceFrench PolynesiaGabonGambia, TheGeorgiaGermanyGhanaGreeceGreenlandGrenadaGuatemalaGuineaGuinea-BissauGuyanaHaitiHeavily indebted poor countries (HIPC)High incomeHondurasHong Kong SAR, ChinaHungaryIBRD onlyIcelandIDA & IBRD totalIDA blendIDA onlyIDA totalIndiaIndonesiaIran, Islamic Rep.IraqIrelandIsraelItalyJamaicaJapanJordanKazakhstanKenyaKiribatiKorea, Rep.KuwaitKyrgyz RepublicLao PDRLate-demographic dividendLatin America & Caribbean Latin America & Caribbean (excluding high income)Latin America & the Caribbean (IDA & IBRD countries)LatviaLeast developed countries: UN classificationLebanonLesothoLiberiaLibyaLithuaniaLow & middle incomeLower middle incomeLuxembourgMacao SAR, ChinaMacedonia, FYRMadagascarMalawiMalaysiaMaldivesMaliMaltaMauritaniaMauritiusMexicoMiddle East & North AfricaMiddle East & North Africa (excluding high income)Middle East & North Africa (IDA & IBRD countries)Middle incomeMoldovaMongoliaMoroccoMozambiqueMyanmarNamibiaNepalNetherlandsNew CaledoniaNew ZealandNicaraguaNigerNigeriaNorth AmericaNorwayOECD membersOmanOther small statesPacific island small statesPakistanPalauPanamaPapua New GuineaParaguayPeruPhilippinesPolandPortugalPost-demographic dividendPre-demographic dividendQatarRomaniaRussian FederationRwandaSamoaSao Tome and PrincipeSaudi ArabiaSenegalSerbiaSeychellesSierra LeoneSingaporeSlovak RepublicSloveniaSmall statesSolomon IslandsSomaliaSouth AfricaSouth AsiaSouth Asia (IDA & IBRD)SpainSri LankaSt. Kitts and NevisSt. LuciaSt. Vincent and the GrenadinesSub-Saharan Africa Sub-Saharan Africa (excluding high income)Sub-Saharan Africa (IDA & IBRD countries)SudanSurinameSwazilandSwedenSwitzerlandSyrian Arab RepublicTajikistanTanzaniaThailandTimor-LesteTogoTongaTrinidad and TobagoTunisiaTurkeyTurkmenistanTurks and Caicos IslandsTuvaluUgandaUkraineUnited Arab EmiratesUnited KingdomUnited StatesUpper middle incomeUruguayVanuatuVenezuela, RBVietnamVirgin Islands (U.S.)WorldYemen, Rep.ZambiaZimbabwe Timeline:
This timeline shows a graph from 1963 to 2016 of Colombia. No data until 1962. Number of actual observations by date: 54.
Source name:
World Development Indicators
Source organization:
World Bank staff estimates from the Comtrade database maintained by the United Nations Statistics Division.
Categories, topics:
Private Sector, Trade
Last updated:
apr 23, 2017
Indicators value changes by year
Maximum:
77.265
jan 1, 1963
At the date of observation
Value
Absolute change
Change from previous value
jan 1, 1963
77.265
+77.265
0.0%
jan 1, 1964
74.498
-2.767
-3.58%
jan 1, 1965
77.078
+2.58
3.46%
jan 1, 1966
72.594
-4.484
-5.82%
jan 1, 1967
73.923
+1.328
1.83%
jan 1, 1968
72.987
-0.936
-1.27%
jan 1, 1969
73.416
+0.429
0.59%
jan 1, 1970
68.762
-4.654
-6.34%
jan 1, 1971
75.0
+6.238
9.07%
jan 1, 1972
70.147
-4.852
-6.47%
jan 1, 1973
64.12
-6.027
-8.59%
jan 1, 1974
62.544
-1.576
-2.46%
jan 1, 1975
57.979
-4.565
-7.3%
jan 1, 1976
64.736
+6.758
11.66%
jan 1, 1977
68.497
+3.76
5.81%
jan 1, 1978
70.542
+2.046
2.99%
jan 1, 1979
74.375
+3.832
5.43%
jan 1, 1980
70.661
-3.713
-4.99%
jan 1, 1981
71.795
+1.134
1.61%
jan 1, 1982
62.847
-8.948
-12.46%
jan 1, 1983
63.337
+0.491
0.78%
jan 1, 1984
61.134
-2.204
-3.48%
jan 1, 1985
62.043
+0.909
1.49%
jan 1, 1986
59.278
-2.765
-4.46%
jan 1, 1987
67.224
+7.946
13.41%
jan 1, 1988
41.774
-25.45
-37.86%
jan 1, 1989
43.426
+1.652
3.96%
jan 1, 1990
37.45
-5.977
-13.76%
jan 1, 1991
32.83
-4.62
-12.34%
jan 1, 1992
32.437
-0.392
-1.2%
jan 1, 1993
33.101
+0.664
2.05%
jan 1, 1994
29.895
-3.206
-9.69%
jan 1, 1995
38.037
+8.142
27.23%
jan 1, 1996
31.355
-6.682
-17.57%
jan 1, 1997
27.203
-4.152
-13.24%
jan 1, 1998
32.131
+4.928
18.12%
jan 1, 1999
31.648
-0.483
-1.5%
jan 1, 2000
24.082
-7.566
-23.91%
jan 1, 2001
19.017
-5.065
-21.03%
jan 1, 2002
18.161
-0.856
-4.5%
jan 1, 2003
18.673
+0.512
2.82%
jan 1, 2004
18.216
-0.457
-2.45%
jan 1, 2005
17.453
-0.763
-4.19%
jan 1, 2006
17.671
+0.218
1.25%
jan 1, 2007
16.37
-1.301
-7.36%
jan 1, 2008
15.669
-0.701
-4.28%
jan 1, 2009
14.758
-0.911
-5.82%
jan 1, 2010
15.513
+0.754
5.11%
jan 1, 2011
11.898
-3.614
-23.3%
jan 1, 2012
10.695
-1.203
-10.11%
jan 1, 2013
9.231
-1.464
-13.69%
jan 1, 2014
9.166
-0.065
-0.7%
jan 1, 2015
10.923
+1.757
19.17%
jan 1, 2016
15.906
+4.982
45.61%
Ranking of countries by current statistics by years


Comments: