29
/
en
AIzaSyAYiBZKx7MnpbEhh9jyipgxe19OcubqV5w
April 1, 2024
161443
Italy
ITA
true
2
1
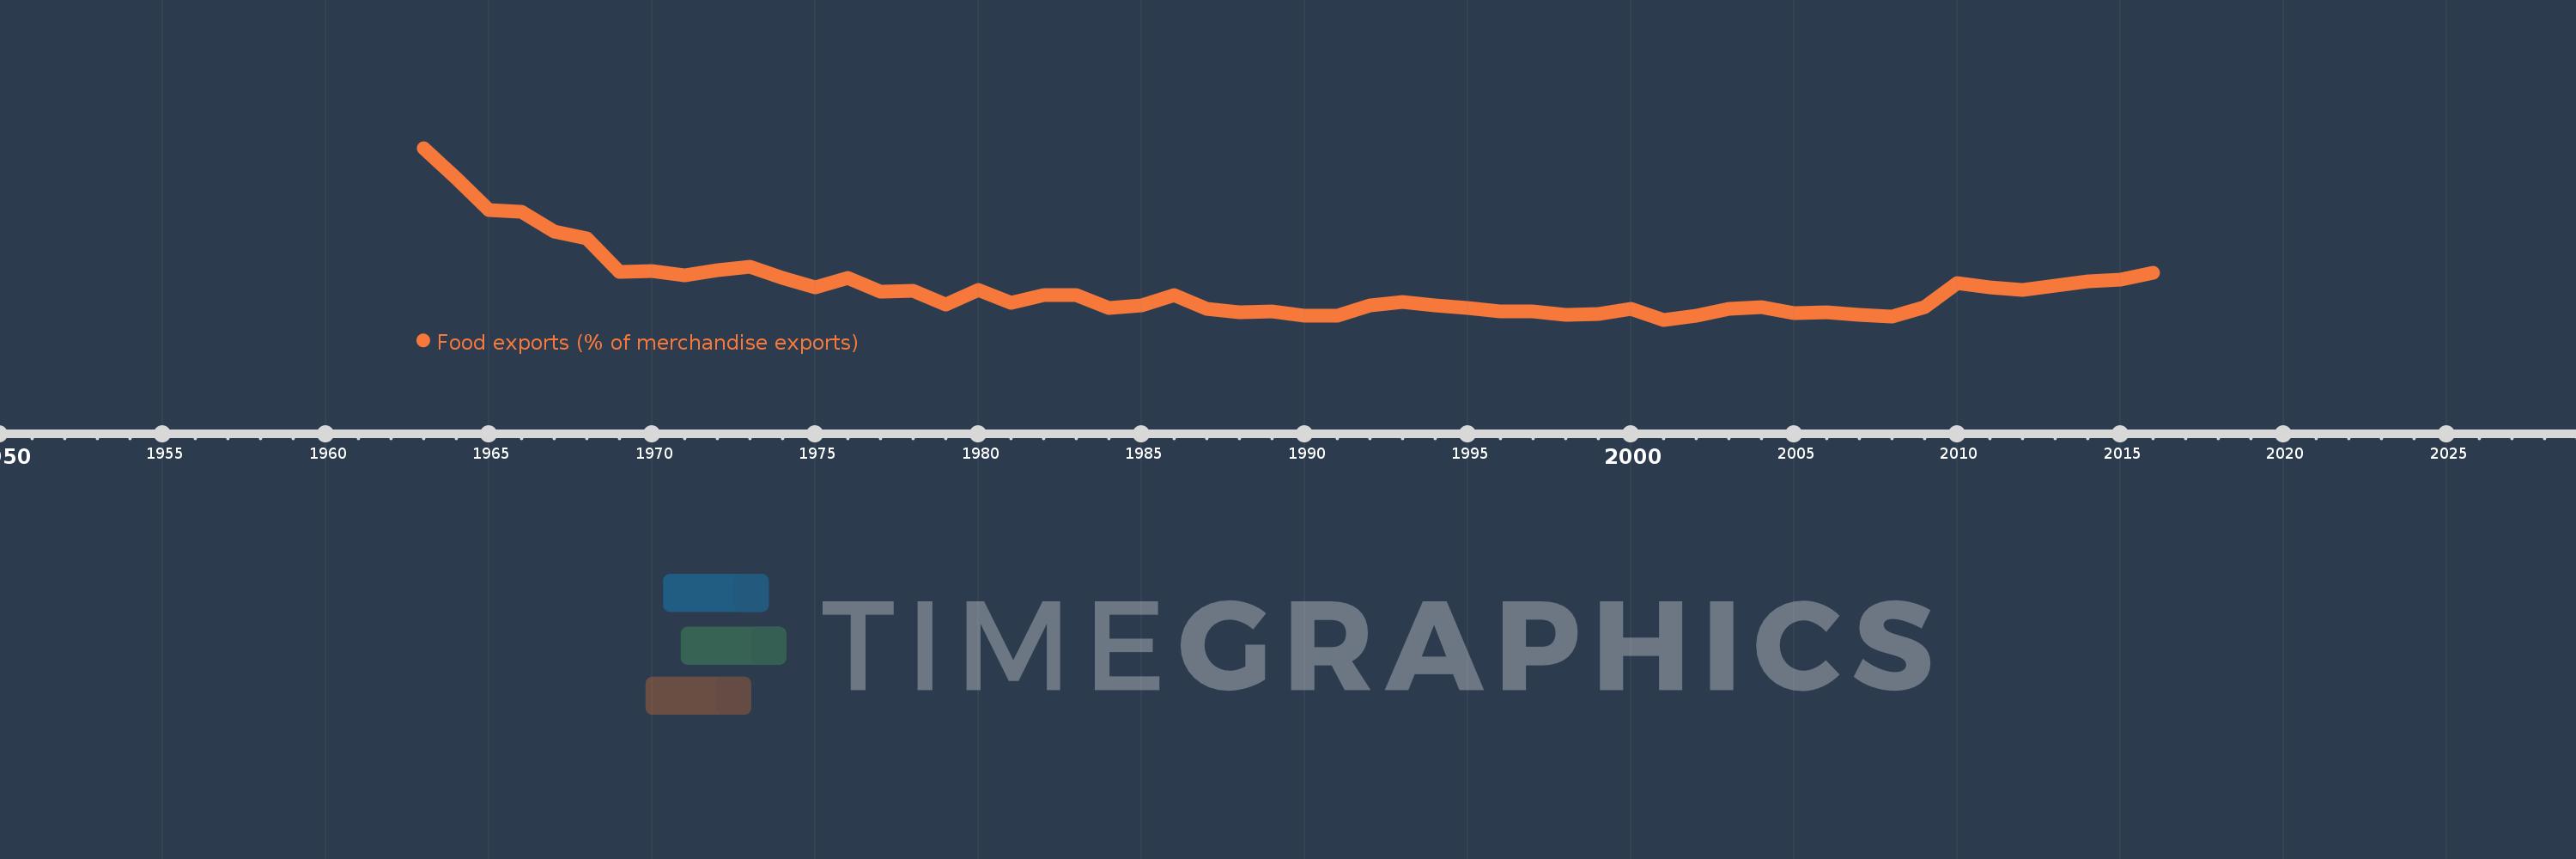
Food exports (% of merchandise exports)
2016,2015,2014,2013,2012,2011,2010,2009,2008,2007,2006,2005,2004,2003,2002,2001,2000,1999,1998,1997,1996,1995,1994,1993,1992,1991,1990,1989,1988,1987,1986,1985,1984,1983,1982,1981,1980,1979,1978,1977,1976,1975,1974,1973,1972,1971,1970,1969,1968,1967,1966,1965,1964,1963
This statistics in other country:
AfghanistanAlbaniaAlgeriaAndorraAngolaAntigua and BarbudaArab WorldArgentinaArmeniaArubaAustraliaAustriaAzerbaijanBahamas, TheBahrainBangladeshBarbadosBelarusBelgiumBelizeBeninBermudaBhutanBoliviaBosnia and HerzegovinaBotswanaBrazilBrunei DarussalamBulgariaBurkina FasoBurundiCabo VerdeCambodiaCameroonCanadaCaribbean small statesCayman IslandsCentral African RepublicCentral Europe and the BalticsChadChileChinaColombiaComorosCongo, Dem. Rep.Congo, Rep.Costa RicaCote d'IvoireCroatiaCubaCyprusCzech RepublicDenmarkDjiboutiDominicaDominican RepublicEarly-demographic dividendEast Asia & PacificEast Asia & Pacific (excluding high income)East Asia & Pacific (IDA & IBRD countries)EcuadorEgypt, Arab Rep.El SalvadorEquatorial GuineaEritreaEstoniaEthiopiaEuro areaEurope & Central AsiaEurope & Central Asia (excluding high income)Europe & Central Asia (IDA & IBRD countries)European UnionFaroe IslandsFijiFinlandFragile and conflict affected situationsFranceFrench PolynesiaGabonGambia, TheGeorgiaGermanyGhanaGreeceGreenlandGrenadaGuatemalaGuineaGuinea-BissauGuyanaHaitiHeavily indebted poor countries (HIPC)High incomeHondurasHong Kong SAR, ChinaHungaryIBRD onlyIcelandIDA & IBRD totalIDA blendIDA onlyIDA totalIndiaIndonesiaIran, Islamic Rep.IraqIrelandIsraelItalyJamaicaJapanJordanKazakhstanKenyaKiribatiKorea, Rep.KuwaitKyrgyz RepublicLao PDRLate-demographic dividendLatin America & Caribbean Latin America & Caribbean (excluding high income)Latin America & the Caribbean (IDA & IBRD countries)LatviaLeast developed countries: UN classificationLebanonLesothoLiberiaLibyaLithuaniaLow & middle incomeLower middle incomeLuxembourgMacao SAR, ChinaMacedonia, FYRMadagascarMalawiMalaysiaMaldivesMaliMaltaMauritaniaMauritiusMexicoMiddle East & North AfricaMiddle East & North Africa (excluding high income)Middle East & North Africa (IDA & IBRD countries)Middle incomeMoldovaMongoliaMoroccoMozambiqueMyanmarNamibiaNepalNetherlandsNew CaledoniaNew ZealandNicaraguaNigerNigeriaNorth AmericaNorwayOECD membersOmanOther small statesPacific island small statesPakistanPalauPanamaPapua New GuineaParaguayPeruPhilippinesPolandPortugalPost-demographic dividendPre-demographic dividendQatarRomaniaRussian FederationRwandaSamoaSao Tome and PrincipeSaudi ArabiaSenegalSerbiaSeychellesSierra LeoneSingaporeSlovak RepublicSloveniaSmall statesSolomon IslandsSomaliaSouth AfricaSouth AsiaSouth Asia (IDA & IBRD)SpainSri LankaSt. Kitts and NevisSt. LuciaSt. Vincent and the GrenadinesSub-Saharan Africa Sub-Saharan Africa (excluding high income)Sub-Saharan Africa (IDA & IBRD countries)SudanSurinameSwazilandSwedenSwitzerlandSyrian Arab RepublicTajikistanTanzaniaThailandTimor-LesteTogoTongaTrinidad and TobagoTunisiaTurkeyTurkmenistanTurks and Caicos IslandsTuvaluUgandaUkraineUnited Arab EmiratesUnited KingdomUnited StatesUpper middle incomeUruguayVanuatuVenezuela, RBVietnamVirgin Islands (U.S.)WorldYemen, Rep.ZambiaZimbabwe Timeline:
This timeline shows a graph from 1963 to 2016 of Italy. No data until 1962. Number of actual observations by date: 54.
Source name:
World Development Indicators
Source organization:
World Bank staff estimates from the Comtrade database maintained by the United Nations Statistics Division.
Categories, topics:
Private Sector, Trade
Last updated:
apr 23, 2017
Indicators value changes by year
Maximum:
15.504
jan 1, 1963
At the date of observation
Value
Absolute change
Change from previous value
jan 1, 1963
15.504
+15.504
0.0%
jan 1, 1964
13.865
-1.639
-10.57%
jan 1, 1965
12.099
-1.765
-12.73%
jan 1, 1966
11.999
-0.1
-0.83%
jan 1, 1967
10.929
-1.071
-8.92%
jan 1, 1968
10.555
-0.373
-3.42%
jan 1, 1969
8.724
-1.831
-17.35%
jan 1, 1970
8.751
+0.027
0.31%
jan 1, 1971
8.532
-0.219
-2.5%
jan 1, 1972
8.816
+0.284
3.33%
jan 1, 1973
9.012
+0.196
2.23%
jan 1, 1974
8.402
-0.61
-6.77%
jan 1, 1975
7.87
-0.532
-6.34%
jan 1, 1976
8.388
+0.518
6.59%
jan 1, 1977
7.636
-0.752
-8.97%
jan 1, 1978
7.692
+0.056
0.73%
jan 1, 1979
6.915
-0.777
-10.1%
jan 1, 1980
7.741
+0.826
11.94%
jan 1, 1981
7.017
-0.724
-9.35%
jan 1, 1982
7.438
+0.421
6.0%
jan 1, 1983
7.426
-0.012
-0.16%
jan 1, 1984
6.744
-0.682
-9.19%
jan 1, 1985
6.9
+0.156
2.32%
jan 1, 1986
7.454
+0.554
8.03%
jan 1, 1987
6.7
-0.755
-10.12%
jan 1, 1988
6.53
-0.17
-2.53%
jan 1, 1989
6.567
+0.037
0.56%
jan 1, 1990
6.303
-0.264
-4.02%
jan 1, 1991
6.301
-0.002
-0.03%
jan 1, 1992
6.878
+0.576
9.15%
jan 1, 1993
7.071
+0.193
2.81%
jan 1, 1994
6.881
-0.189
-2.68%
jan 1, 1995
6.736
-0.146
-2.12%
jan 1, 1996
6.553
-0.183
-2.72%
jan 1, 1997
6.56
+0.007
0.11%
jan 1, 1998
6.378
-0.182
-2.78%
jan 1, 1999
6.415
+0.037
0.58%
jan 1, 2000
6.694
+0.279
4.35%
jan 1, 2001
6.099
-0.595
-8.88%
jan 1, 2002
6.304
+0.205
3.36%
jan 1, 2003
6.717
+0.413
6.55%
jan 1, 2004
6.799
+0.082
1.22%
jan 1, 2005
6.462
-0.337
-4.96%
jan 1, 2006
6.508
+0.046
0.72%
jan 1, 2007
6.349
-0.159
-2.45%
jan 1, 2008
6.287
-0.062
-0.97%
jan 1, 2009
6.785
+0.498
7.92%
jan 1, 2010
8.098
+1.313
19.35%
jan 1, 2011
7.888
-0.21
-2.6%
jan 1, 2012
7.724
-0.164
-2.08%
jan 1, 2013
7.972
+0.248
3.22%
jan 1, 2014
8.199
+0.226
2.84%
jan 1, 2015
8.272
+0.074
0.9%
jan 1, 2016
8.658
+0.386
4.66%
Ranking of countries by current statistics by years


Comments: