29
/
en
AIzaSyAYiBZKx7MnpbEhh9jyipgxe19OcubqV5w
April 1, 2024
126154
El Salvador
SLV
true
2
1
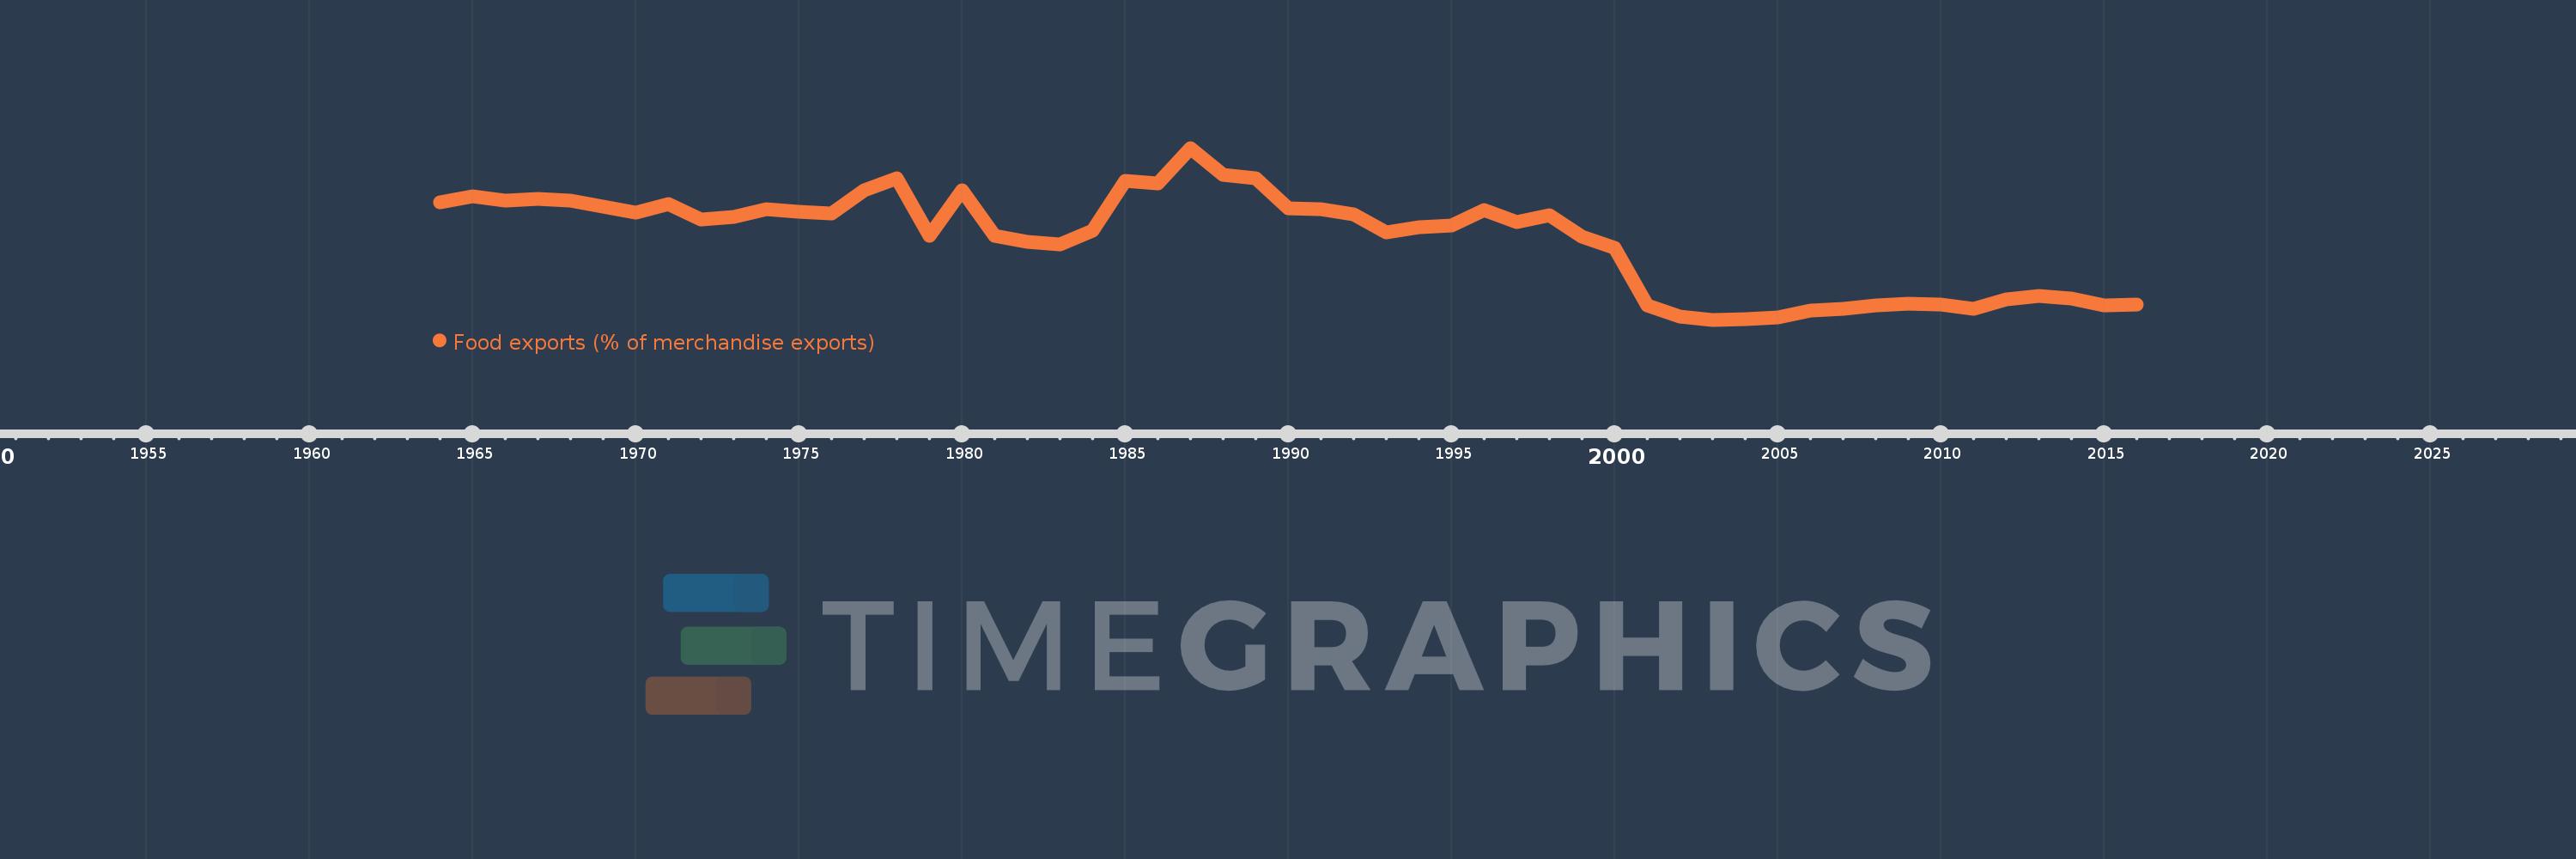
Food exports (% of merchandise exports)
2016,2015,2014,2013,2012,2011,2010,2009,2008,2007,2006,2005,2004,2003,2002,2001,2000,1999,1998,1997,1996,1995,1994,1993,1992,1991,1990,1989,1988,1987,1986,1985,1984,1983,1982,1981,1980,1979,1978,1977,1976,1975,1974,1973,1972,1971,1970,1969,1968,1967,1966,1965,1964
This statistics in other country:
AfghanistanAlbaniaAlgeriaAndorraAngolaAntigua and BarbudaArab WorldArgentinaArmeniaArubaAustraliaAustriaAzerbaijanBahamas, TheBahrainBangladeshBarbadosBelarusBelgiumBelizeBeninBermudaBhutanBoliviaBosnia and HerzegovinaBotswanaBrazilBrunei DarussalamBulgariaBurkina FasoBurundiCabo VerdeCambodiaCameroonCanadaCaribbean small statesCayman IslandsCentral African RepublicCentral Europe and the BalticsChadChileChinaColombiaComorosCongo, Dem. Rep.Congo, Rep.Costa RicaCote d'IvoireCroatiaCubaCyprusCzech RepublicDenmarkDjiboutiDominicaDominican RepublicEarly-demographic dividendEast Asia & PacificEast Asia & Pacific (excluding high income)East Asia & Pacific (IDA & IBRD countries)EcuadorEgypt, Arab Rep.El SalvadorEquatorial GuineaEritreaEstoniaEthiopiaEuro areaEurope & Central AsiaEurope & Central Asia (excluding high income)Europe & Central Asia (IDA & IBRD countries)European UnionFaroe IslandsFijiFinlandFragile and conflict affected situationsFranceFrench PolynesiaGabonGambia, TheGeorgiaGermanyGhanaGreeceGreenlandGrenadaGuatemalaGuineaGuinea-BissauGuyanaHaitiHeavily indebted poor countries (HIPC)High incomeHondurasHong Kong SAR, ChinaHungaryIBRD onlyIcelandIDA & IBRD totalIDA blendIDA onlyIDA totalIndiaIndonesiaIran, Islamic Rep.IraqIrelandIsraelItalyJamaicaJapanJordanKazakhstanKenyaKiribatiKorea, Rep.KuwaitKyrgyz RepublicLao PDRLate-demographic dividendLatin America & Caribbean Latin America & Caribbean (excluding high income)Latin America & the Caribbean (IDA & IBRD countries)LatviaLeast developed countries: UN classificationLebanonLesothoLiberiaLibyaLithuaniaLow & middle incomeLower middle incomeLuxembourgMacao SAR, ChinaMacedonia, FYRMadagascarMalawiMalaysiaMaldivesMaliMaltaMauritaniaMauritiusMexicoMiddle East & North AfricaMiddle East & North Africa (excluding high income)Middle East & North Africa (IDA & IBRD countries)Middle incomeMoldovaMongoliaMoroccoMozambiqueMyanmarNamibiaNepalNetherlandsNew CaledoniaNew ZealandNicaraguaNigerNigeriaNorth AmericaNorwayOECD membersOmanOther small statesPacific island small statesPakistanPalauPanamaPapua New GuineaParaguayPeruPhilippinesPolandPortugalPost-demographic dividendPre-demographic dividendQatarRomaniaRussian FederationRwandaSamoaSao Tome and PrincipeSaudi ArabiaSenegalSerbiaSeychellesSierra LeoneSingaporeSlovak RepublicSloveniaSmall statesSolomon IslandsSomaliaSouth AfricaSouth AsiaSouth Asia (IDA & IBRD)SpainSri LankaSt. Kitts and NevisSt. LuciaSt. Vincent and the GrenadinesSub-Saharan Africa Sub-Saharan Africa (excluding high income)Sub-Saharan Africa (IDA & IBRD countries)SudanSurinameSwazilandSwedenSwitzerlandSyrian Arab RepublicTajikistanTanzaniaThailandTimor-LesteTogoTongaTrinidad and TobagoTunisiaTurkeyTurkmenistanTurks and Caicos IslandsTuvaluUgandaUkraineUnited Arab EmiratesUnited KingdomUnited StatesUpper middle incomeUruguayVanuatuVenezuela, RBVietnamVirgin Islands (U.S.)WorldYemen, Rep.ZambiaZimbabwe Timeline:
This timeline shows a graph from 1964 to 2016 of El Salvador. No data until 1963. Number of actual observations by date: 53.
Source name:
World Development Indicators
Source organization:
World Bank staff estimates from the Comtrade database maintained by the United Nations Statistics Division.
Categories, topics:
Private Sector, Trade
Last updated:
apr 23, 2017
Indicators value changes by year
Minimum:
13.465
jan 1, 2003
Maximum:
81.721
jan 1, 1987
At the date of observation
Value
Absolute change
Change from previous value
jan 1, 1964
60.094
+60.094
0.0%
jan 1, 1965
62.551
+2.457
4.09%
jan 1, 1966
60.736
-1.815
-2.9%
jan 1, 1967
61.498
+0.762
1.25%
jan 1, 1968
60.791
-0.707
-1.15%
jan 1, 1969
58.426
-2.365
-3.89%
jan 1, 1970
55.999
-2.428
-4.16%
jan 1, 1971
59.367
+3.368
6.01%
jan 1, 1972
53.329
-6.038
-10.17%
jan 1, 1973
54.302
+0.973
1.82%
jan 1, 1974
57.352
+3.049
5.62%
jan 1, 1975
56.451
-0.9
-1.57%
jan 1, 1976
55.673
-0.779
-1.38%
jan 1, 1977
64.898
+9.226
16.57%
jan 1, 1978
69.707
+4.809
7.41%
jan 1, 1979
46.928
-22.779
-32.68%
jan 1, 1980
64.987
+18.059
38.48%
jan 1, 1981
46.795
-18.192
-27.99%
jan 1, 1982
44.573
-2.222
-4.75%
jan 1, 1983
43.229
-1.344
-3.02%
jan 1, 1984
48.75
+5.521
12.77%
jan 1, 1985
68.484
+19.734
40.48%
jan 1, 1986
67.588
-0.896
-1.31%
jan 1, 1987
81.721
+14.133
20.91%
jan 1, 1988
70.972
-10.749
-13.15%
jan 1, 1989
69.599
-1.372
-1.93%
jan 1, 1990
57.771
-11.828
-16.99%
jan 1, 1991
57.238
-0.534
-0.92%
jan 1, 1992
55.377
-1.861
-3.25%
jan 1, 1993
48.098
-7.279
-13.15%
jan 1, 1994
50.35
+2.253
4.68%
jan 1, 1995
50.878
+0.528
1.05%
jan 1, 1996
56.999
+6.121
12.03%
jan 1, 1997
52.383
-4.616
-8.1%
jan 1, 1998
55.114
+2.731
5.21%
jan 1, 1999
46.637
-8.477
-15.38%
jan 1, 2000
42.079
-4.558
-9.77%
jan 1, 2001
19.2
-22.879
-54.37%
jan 1, 2002
14.729
-4.471
-23.29%
jan 1, 2003
13.465
-1.264
-8.58%
jan 1, 2004
13.548
+0.083
0.62%
jan 1, 2005
14.217
+0.669
4.94%
jan 1, 2006
17.209
+2.991
21.04%
jan 1, 2007
17.731
+0.522
3.03%
jan 1, 2008
19.155
+1.425
8.04%
jan 1, 2009
19.698
+0.543
2.83%
jan 1, 2010
19.55
-0.148
-0.75%
jan 1, 2011
17.822
-1.729
-8.84%
jan 1, 2012
21.432
+3.61
20.26%
jan 1, 2013
22.947
+1.515
7.07%
jan 1, 2014
21.889
-1.057
-4.61%
jan 1, 2015
19.142
-2.748
-12.55%
jan 1, 2016
19.588
+0.446
2.33%
Ranking of countries by current statistics by years


Comments: