29
/
en
AIzaSyAYiBZKx7MnpbEhh9jyipgxe19OcubqV5w
April 1, 2024
72510
Aruba
ABW
true
2
1
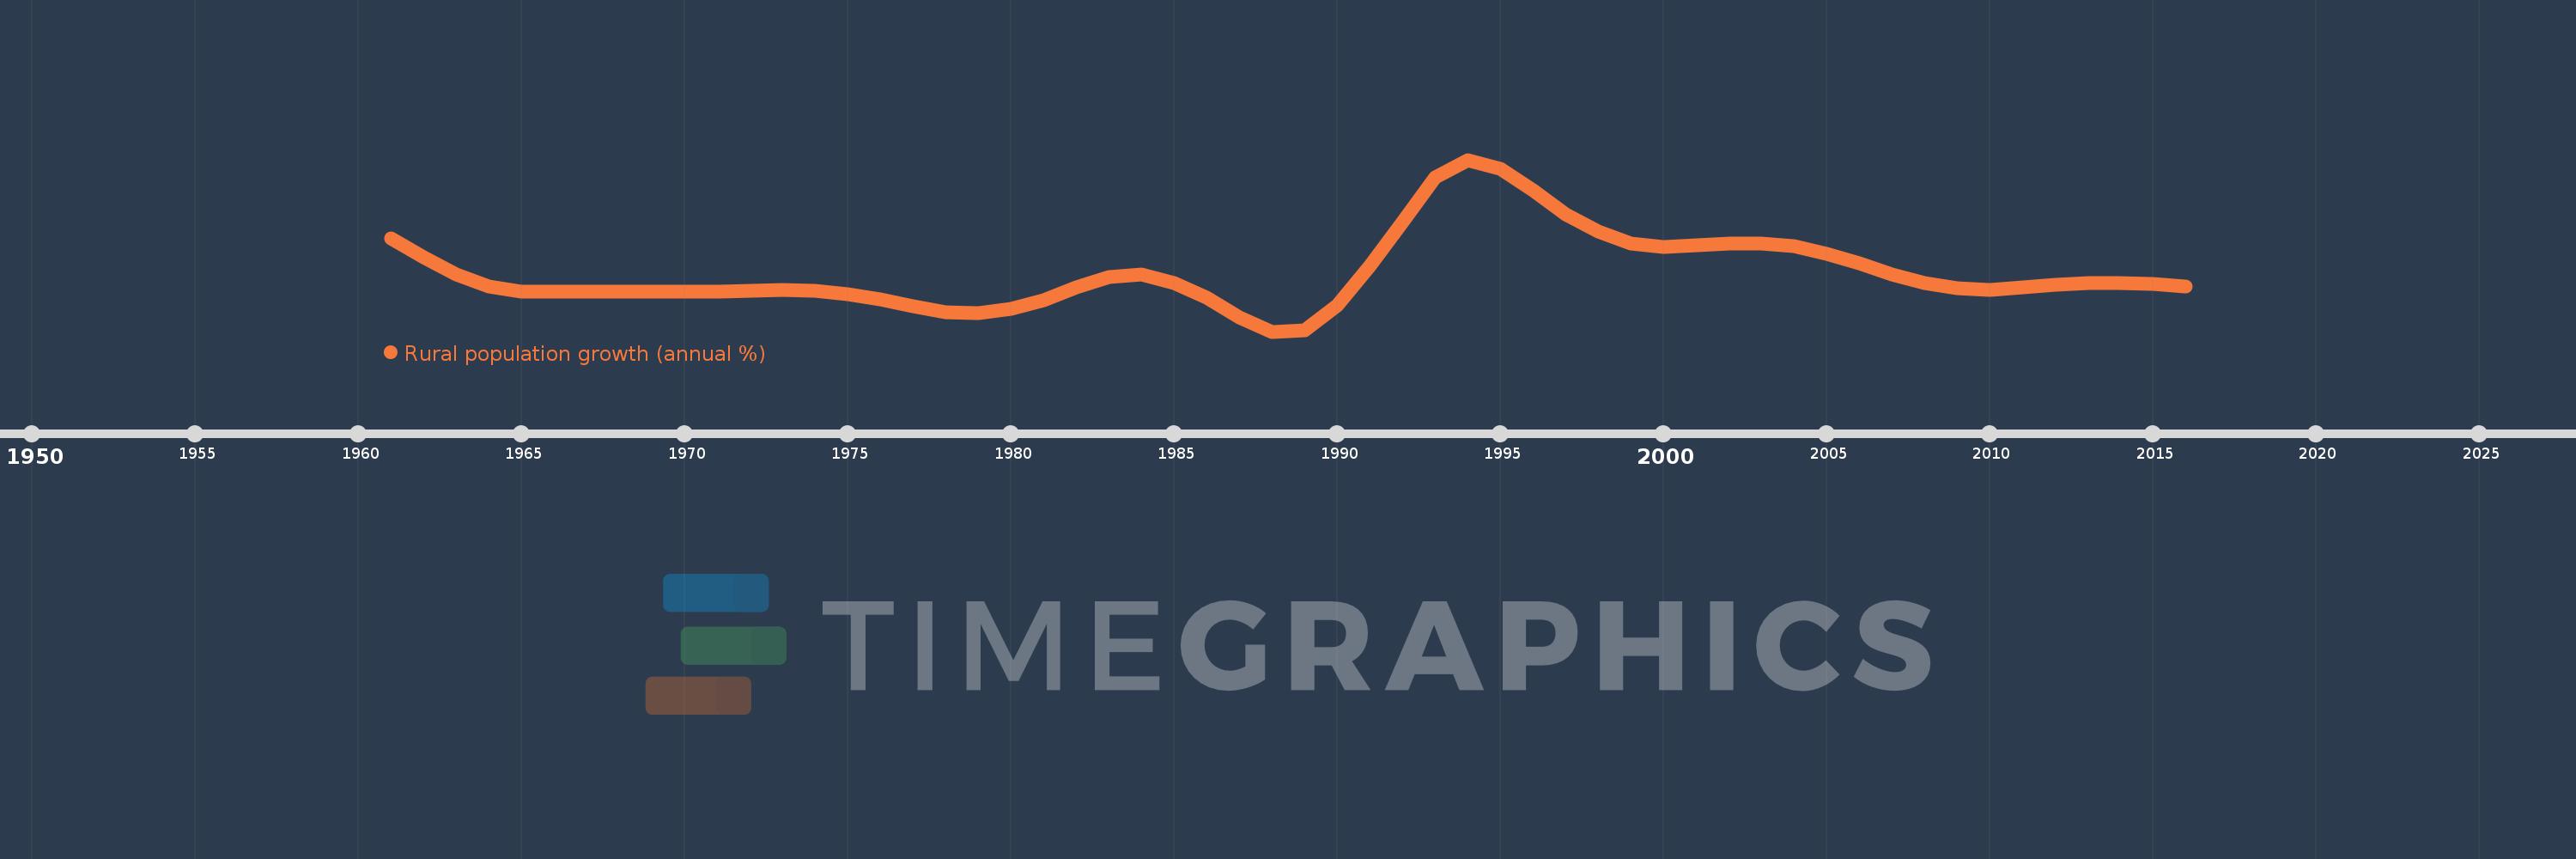
Rural population growth (annual %)
2016,2015,2014,2013,2012,2011,2010,2009,2008,2007,2006,2005,2004,2003,2002,2001,2000,1999,1998,1997,1996,1995,1994,1993,1992,1991,1990,1989,1988,1987,1986,1985,1984,1983,1982,1981,1980,1979,1978,1977,1976,1975,1974,1973,1972,1971,1970,1969,1968,1967,1966,1965,1964,1963,1962,1961
This statistics in other country:
AfghanistanAlbaniaAlgeriaAmerican SamoaAndorraAngolaAntigua and BarbudaArab WorldArgentinaArmeniaArubaAustraliaAustriaAzerbaijanBahamas, TheBahrainBangladeshBarbadosBelarusBelgiumBelizeBeninBhutanBoliviaBosnia and HerzegovinaBotswanaBrazilBritish Virgin IslandsBrunei DarussalamBulgariaBurkina FasoBurundiCabo VerdeCambodiaCameroonCanadaCaribbean small statesCentral African RepublicCentral Europe and the BalticsChadChannel IslandsChileChinaColombiaComorosCongo, Dem. Rep.Congo, Rep.Costa RicaCote d'IvoireCroatiaCubaCuracaoCyprusCzech RepublicDenmarkDjiboutiDominicaDominican RepublicEarly-demographic dividendEast Asia & PacificEast Asia & Pacific (excluding high income)East Asia & Pacific (IDA & IBRD countries)EcuadorEgypt, Arab Rep.El SalvadorEquatorial GuineaEritreaEstoniaEthiopiaEuro areaEurope & Central AsiaEurope & Central Asia (excluding high income)Europe & Central Asia (IDA & IBRD countries)European UnionFaroe IslandsFijiFinlandFragile and conflict affected situationsFranceFrench PolynesiaGabonGambia, TheGeorgiaGermanyGhanaGreeceGreenlandGrenadaGuamGuatemalaGuineaGuinea-BissauGuyanaHaitiHeavily indebted poor countries (HIPC)High incomeHondurasHong Kong SAR, ChinaHungaryIBRD onlyIcelandIDA & IBRD totalIDA blendIDA onlyIDA totalIndiaIndonesiaIran, Islamic Rep.IraqIrelandIsle of ManIsraelItalyJamaicaJapanJordanKazakhstanKenyaKiribatiKorea, Dem. People’s Rep.Korea, Rep.KuwaitKyrgyz RepublicLao PDRLate-demographic dividendLatin America & Caribbean Latin America & Caribbean (excluding high income)Latin America & the Caribbean (IDA & IBRD countries)LatviaLeast developed countries: UN classificationLebanonLesothoLiberiaLibyaLiechtensteinLithuaniaLow & middle incomeLow incomeLower middle incomeLuxembourgMacao SAR, ChinaMacedonia, FYRMadagascarMalawiMalaysiaMaldivesMaliMaltaMarshall IslandsMauritaniaMauritiusMexicoMicronesia, Fed. Sts.Middle East & North AfricaMiddle East & North Africa (excluding high income)Middle East & North Africa (IDA & IBRD countries)Middle incomeMoldovaMongoliaMontenegroMoroccoMozambiqueMyanmarNamibiaNauruNepalNetherlandsNew CaledoniaNew ZealandNicaraguaNigerNigeriaNorth AmericaNorthern Mariana IslandsNorwayOECD membersOmanOther small statesPacific island small statesPakistanPalauPanamaPapua New GuineaParaguayPeruPhilippinesPolandPortugalPost-demographic dividendPre-demographic dividendPuerto RicoQatarRomaniaRussian FederationRwandaSamoaSan MarinoSao Tome and PrincipeSaudi ArabiaSenegalSerbiaSeychellesSierra LeoneSlovak RepublicSloveniaSmall statesSolomon IslandsSomaliaSouth AfricaSouth AsiaSouth Asia (IDA & IBRD)South SudanSpainSri LankaSt. Kitts and NevisSt. LuciaSt. Vincent and the GrenadinesSub-Saharan Africa Sub-Saharan Africa (excluding high income)Sub-Saharan Africa (IDA & IBRD countries)SudanSurinameSwazilandSwedenSwitzerlandSyrian Arab RepublicTajikistanTanzaniaThailandTimor-LesteTogoTongaTrinidad and TobagoTunisiaTurkeyTurkmenistanTurks and Caicos IslandsTuvaluUgandaUkraineUnited Arab EmiratesUnited KingdomUnited StatesUpper middle incomeUruguayUzbekistanVanuatuVenezuela, RBVietnamVirgin Islands (U.S.)West Bank and GazaWorldYemen, Rep.ZambiaZimbabwe Timeline:
This timeline shows a graph from 1961 to 2016 of Aruba. No data until 1960. Number of actual observations by date: 56.
Source name:
World Development Indicators
Source organization:
World Bank Staff estimates based on United Nations, World Urbanization Prospects.
Categories, topics:
Agriculture & Rural Development
Last updated:
apr 23, 2017
Indicators value changes by year
Minimum:
-1.269
jan 1, 1988
At the date of observation
Value
Absolute change
Change from previous value
jan 1, 1961
3.164
+3.164
0.0%
jan 1, 1962
2.271
-0.893
-28.21%
jan 1, 1963
1.448
-0.824
-36.27%
jan 1, 1964
0.866
-0.581
-40.14%
jan 1, 1965
0.614
-0.253
-29.16%
jan 1, 1966
0.607
-0.007
-1.19%
jan 1, 1967
0.645
+0.039
6.35%
jan 1, 1968
0.613
-0.032
-4.97%
jan 1, 1969
0.609
-0.004
-0.61%
jan 1, 1970
0.609
0.0
-0.04%
jan 1, 1971
0.609
0.0
-0.04%
jan 1, 1972
0.66
+0.051
8.35%
jan 1, 1973
0.723
+0.063
9.6%
jan 1, 1974
0.677
-0.045
-6.29%
jan 1, 1975
0.506
-0.172
-25.32%
jan 1, 1976
0.244
-0.262
-51.84%
jan 1, 1977
-0.077
-0.32
-131.48%
jan 1, 1978
-0.338
-0.261
340.04%
jan 1, 1979
-0.403
-0.065
19.25%
jan 1, 1980
-0.182
+0.221
-54.87%
jan 1, 1981
0.225
+0.407
-224.05%
jan 1, 1982
0.813
+0.588
260.81%
jan 1, 1983
1.304
+0.491
60.43%
jan 1, 1984
1.424
+0.119
9.16%
jan 1, 1985
1.032
-0.392
-27.5%
jan 1, 1986
0.346
-0.686
-66.48%
jan 1, 1987
-0.581
-0.927
-267.79%
jan 1, 1988
-1.269
-0.689
118.59%
jan 1, 1989
-1.203
+0.066
-5.21%
jan 1, 1990
-0.043
+1.16
-96.44%
jan 1, 1991
1.844
+1.886
-4.4K%
jan 1, 1992
3.934
+2.091
113.41%
jan 1, 1993
6.053
+2.119
53.85%
jan 1, 1994
6.877
+0.824
13.61%
jan 1, 1995
6.445
-0.432
-6.29%
jan 1, 1996
5.422
-1.023
-15.87%
jan 1, 1997
4.309
-1.113
-20.53%
jan 1, 1998
3.463
-0.846
-19.63%
jan 1, 1999
2.9
-0.563
-16.25%
jan 1, 2000
2.738
-0.162
-5.6%
jan 1, 2001
2.835
+0.097
3.53%
jan 1, 2002
2.923
+0.089
3.12%
jan 1, 2003
2.918
-0.005
-0.17%
jan 1, 2004
2.778
-0.14
-4.78%
jan 1, 2005
2.436
-0.343
-12.34%
jan 1, 2006
1.961
-0.474
-19.47%
jan 1, 2007
1.455
-0.507
-25.83%
jan 1, 2008
1.037
-0.418
-28.74%
jan 1, 2009
0.772
-0.265
-25.55%
jan 1, 2010
0.715
-0.056
-7.31%
jan 1, 2011
0.816
+0.1
14.04%
jan 1, 2012
0.965
+0.149
18.3%
jan 1, 2013
1.029
+0.064
6.6%
jan 1, 2014
1.043
+0.015
1.43%
jan 1, 2015
0.985
-0.059
-5.65%
jan 1, 2016
0.863
-0.121
-12.34%
Ranking of countries by current statistics by years


Comments: