29
/
en
AIzaSyAYiBZKx7MnpbEhh9jyipgxe19OcubqV5w
April 1, 2024
142293
Greece
GRC
true
2
1
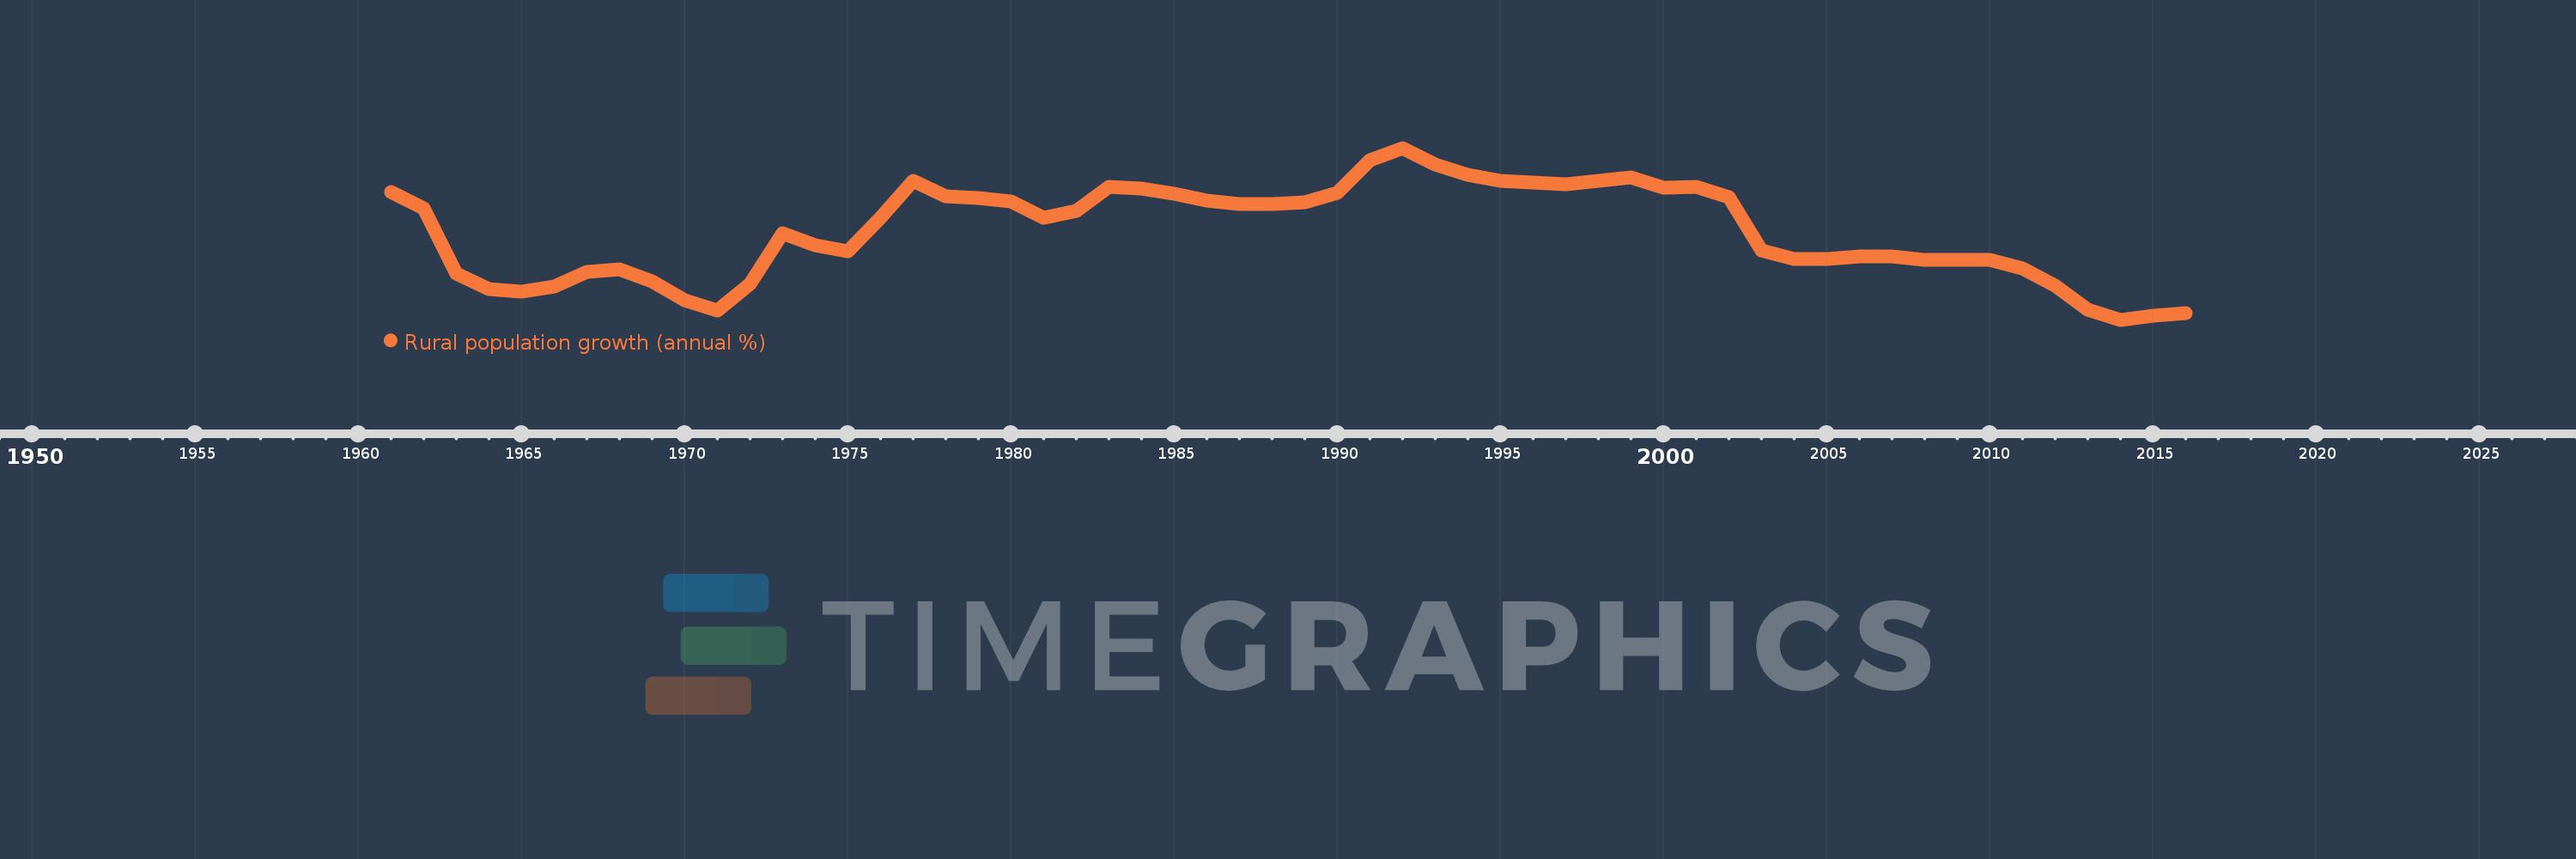
Rural population growth (annual %)
2016,2015,2014,2013,2012,2011,2010,2009,2008,2007,2006,2005,2004,2003,2002,2001,2000,1999,1998,1997,1996,1995,1994,1993,1992,1991,1990,1989,1988,1987,1986,1985,1984,1983,1982,1981,1980,1979,1978,1977,1976,1975,1974,1973,1972,1971,1970,1969,1968,1967,1966,1965,1964,1963,1962,1961
This statistics in other country:
AfghanistanAlbaniaAlgeriaAmerican SamoaAndorraAngolaAntigua and BarbudaArab WorldArgentinaArmeniaArubaAustraliaAustriaAzerbaijanBahamas, TheBahrainBangladeshBarbadosBelarusBelgiumBelizeBeninBhutanBoliviaBosnia and HerzegovinaBotswanaBrazilBritish Virgin IslandsBrunei DarussalamBulgariaBurkina FasoBurundiCabo VerdeCambodiaCameroonCanadaCaribbean small statesCentral African RepublicCentral Europe and the BalticsChadChannel IslandsChileChinaColombiaComorosCongo, Dem. Rep.Congo, Rep.Costa RicaCote d'IvoireCroatiaCubaCuracaoCyprusCzech RepublicDenmarkDjiboutiDominicaDominican RepublicEarly-demographic dividendEast Asia & PacificEast Asia & Pacific (excluding high income)East Asia & Pacific (IDA & IBRD countries)EcuadorEgypt, Arab Rep.El SalvadorEquatorial GuineaEritreaEstoniaEthiopiaEuro areaEurope & Central AsiaEurope & Central Asia (excluding high income)Europe & Central Asia (IDA & IBRD countries)European UnionFaroe IslandsFijiFinlandFragile and conflict affected situationsFranceFrench PolynesiaGabonGambia, TheGeorgiaGermanyGhanaGreeceGreenlandGrenadaGuamGuatemalaGuineaGuinea-BissauGuyanaHaitiHeavily indebted poor countries (HIPC)High incomeHondurasHong Kong SAR, ChinaHungaryIBRD onlyIcelandIDA & IBRD totalIDA blendIDA onlyIDA totalIndiaIndonesiaIran, Islamic Rep.IraqIrelandIsle of ManIsraelItalyJamaicaJapanJordanKazakhstanKenyaKiribatiKorea, Dem. People’s Rep.Korea, Rep.KuwaitKyrgyz RepublicLao PDRLate-demographic dividendLatin America & Caribbean Latin America & Caribbean (excluding high income)Latin America & the Caribbean (IDA & IBRD countries)LatviaLeast developed countries: UN classificationLebanonLesothoLiberiaLibyaLiechtensteinLithuaniaLow & middle incomeLow incomeLower middle incomeLuxembourgMacao SAR, ChinaMacedonia, FYRMadagascarMalawiMalaysiaMaldivesMaliMaltaMarshall IslandsMauritaniaMauritiusMexicoMicronesia, Fed. Sts.Middle East & North AfricaMiddle East & North Africa (excluding high income)Middle East & North Africa (IDA & IBRD countries)Middle incomeMoldovaMongoliaMontenegroMoroccoMozambiqueMyanmarNamibiaNauruNepalNetherlandsNew CaledoniaNew ZealandNicaraguaNigerNigeriaNorth AmericaNorthern Mariana IslandsNorwayOECD membersOmanOther small statesPacific island small statesPakistanPalauPanamaPapua New GuineaParaguayPeruPhilippinesPolandPortugalPost-demographic dividendPre-demographic dividendPuerto RicoQatarRomaniaRussian FederationRwandaSamoaSan MarinoSao Tome and PrincipeSaudi ArabiaSenegalSerbiaSeychellesSierra LeoneSlovak RepublicSloveniaSmall statesSolomon IslandsSomaliaSouth AfricaSouth AsiaSouth Asia (IDA & IBRD)South SudanSpainSri LankaSt. Kitts and NevisSt. LuciaSt. Vincent and the GrenadinesSub-Saharan Africa Sub-Saharan Africa (excluding high income)Sub-Saharan Africa (IDA & IBRD countries)SudanSurinameSwazilandSwedenSwitzerlandSyrian Arab RepublicTajikistanTanzaniaThailandTimor-LesteTogoTongaTrinidad and TobagoTunisiaTurkeyTurkmenistanTurks and Caicos IslandsTuvaluUgandaUkraineUnited Arab EmiratesUnited KingdomUnited StatesUpper middle incomeUruguayUzbekistanVanuatuVenezuela, RBVietnamVirgin Islands (U.S.)West Bank and GazaWorldYemen, Rep.ZambiaZimbabwe Timeline:
This timeline shows a graph from 1961 to 2016 of Greece. No data until 1960. Number of actual observations by date: 56.
Source name:
World Development Indicators
Source organization:
World Bank Staff estimates based on United Nations, World Urbanization Prospects.
Categories, topics:
Agriculture & Rural Development
Last updated:
apr 23, 2017
Indicators value changes by year
Minimum:
-2.228
jan 1, 2014
At the date of observation
Value
Absolute change
Change from previous value
jan 1, 1961
-0.113
-0.113
0.0%
jan 1, 1962
-0.387
-0.274
241.43%
jan 1, 1963
-1.462
-1.075
277.51%
jan 1, 1964
-1.718
-0.256
17.52%
jan 1, 1965
-1.759
-0.041
2.37%
jan 1, 1966
-1.682
+0.077
-4.36%
jan 1, 1967
-1.444
+0.238
-14.15%
jan 1, 1968
-1.401
+0.044
-3.02%
jan 1, 1969
-1.599
-0.198
14.14%
jan 1, 1970
-1.908
-0.31
19.36%
jan 1, 1971
-2.079
-0.171
8.94%
jan 1, 1972
-1.63
+0.448
-21.57%
jan 1, 1973
-0.796
+0.835
-51.21%
jan 1, 1974
-0.998
-0.202
25.44%
jan 1, 1975
-1.099
-0.101
10.16%
jan 1, 1976
-0.539
+0.561
-51.0%
jan 1, 1977
0.063
+0.602
-111.7%
jan 1, 1978
-0.193
-0.256
-405.98%
jan 1, 1979
-0.214
-0.021
10.82%
jan 1, 1980
-0.274
-0.06
28.16%
jan 1, 1981
-0.549
-0.275
100.36%
jan 1, 1982
-0.427
+0.122
-22.27%
jan 1, 1983
-0.027
+0.4
-93.71%
jan 1, 1984
-0.066
-0.039
144.92%
jan 1, 1985
-0.15
-0.084
128.43%
jan 1, 1986
-0.257
-0.107
71.46%
jan 1, 1987
-0.319
-0.062
23.97%
jan 1, 1988
-0.32
-0.001
0.2%
jan 1, 1989
-0.292
+0.028
-8.75%
jan 1, 1990
-0.134
+0.158
-54.07%
jan 1, 1991
0.401
+0.535
-399.21%
jan 1, 1992
0.61
+0.209
52.04%
jan 1, 1993
0.333
-0.277
-45.41%
jan 1, 1994
0.159
-0.174
-52.26%
jan 1, 1995
0.073
-0.086
-54.02%
jan 1, 1996
0.034
-0.039
-53.23%
jan 1, 1997
0.009
-0.025
-72.67%
jan 1, 1998
0.064
+0.054
581.93%
jan 1, 1999
0.119
+0.055
87.09%
jan 1, 2000
-0.05
-0.169
-141.83%
jan 1, 2001
-0.026
+0.024
-47.53%
jan 1, 2002
-0.205
-0.179
683.13%
jan 1, 2003
-1.084
-0.879
429.23%
jan 1, 2004
-1.218
-0.134
12.37%
jan 1, 2005
-1.223
-0.005
0.41%
jan 1, 2006
-1.179
+0.043
-3.56%
jan 1, 2007
-1.178
+0.001
-0.08%
jan 1, 2008
-1.234
-0.056
4.73%
jan 1, 2009
-1.234
+0.0
-0.04%
jan 1, 2010
-1.238
-0.004
0.36%
jan 1, 2011
-1.378
-0.14
11.32%
jan 1, 2012
-1.665
-0.287
20.83%
jan 1, 2013
-2.055
-0.39
23.42%
jan 1, 2014
-2.228
-0.172
8.39%
jan 1, 2015
-2.156
+0.072
-3.23%
jan 1, 2016
-2.117
+0.038
-1.78%
Ranking of countries by current statistics by years


Comments: