29
/
en
AIzaSyAYiBZKx7MnpbEhh9jyipgxe19OcubqV5w
April 1, 2024
217126
Pakistan
PAK
true
2
1
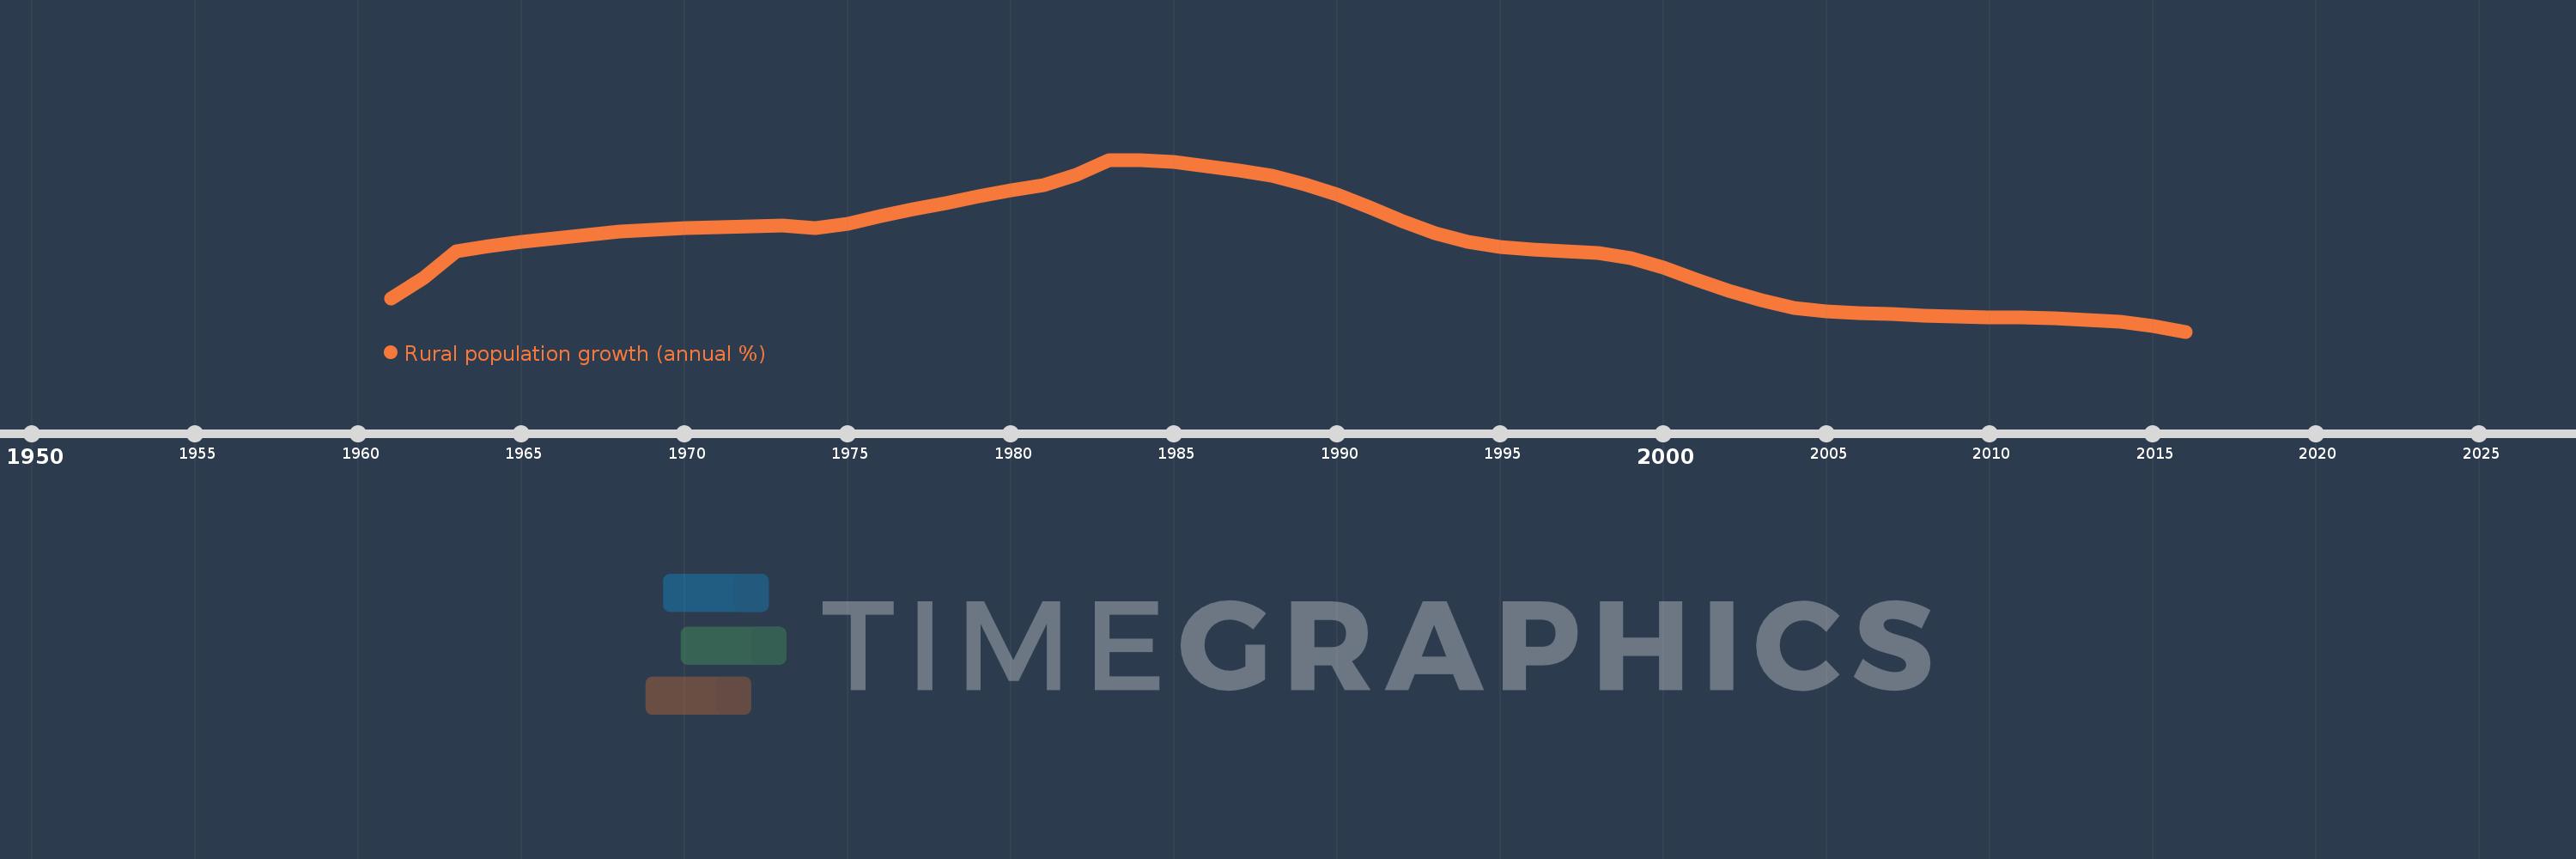
Rural population growth (annual %)
2016,2015,2014,2013,2012,2011,2010,2009,2008,2007,2006,2005,2004,2003,2002,2001,2000,1999,1998,1997,1996,1995,1994,1993,1992,1991,1990,1989,1988,1987,1986,1985,1984,1983,1982,1981,1980,1979,1978,1977,1976,1975,1974,1973,1972,1971,1970,1969,1968,1967,1966,1965,1964,1963,1962,1961
This statistics in other country:
AfghanistanAlbaniaAlgeriaAmerican SamoaAndorraAngolaAntigua and BarbudaArab WorldArgentinaArmeniaArubaAustraliaAustriaAzerbaijanBahamas, TheBahrainBangladeshBarbadosBelarusBelgiumBelizeBeninBhutanBoliviaBosnia and HerzegovinaBotswanaBrazilBritish Virgin IslandsBrunei DarussalamBulgariaBurkina FasoBurundiCabo VerdeCambodiaCameroonCanadaCaribbean small statesCentral African RepublicCentral Europe and the BalticsChadChannel IslandsChileChinaColombiaComorosCongo, Dem. Rep.Congo, Rep.Costa RicaCote d'IvoireCroatiaCubaCuracaoCyprusCzech RepublicDenmarkDjiboutiDominicaDominican RepublicEarly-demographic dividendEast Asia & PacificEast Asia & Pacific (excluding high income)East Asia & Pacific (IDA & IBRD countries)EcuadorEgypt, Arab Rep.El SalvadorEquatorial GuineaEritreaEstoniaEthiopiaEuro areaEurope & Central AsiaEurope & Central Asia (excluding high income)Europe & Central Asia (IDA & IBRD countries)European UnionFaroe IslandsFijiFinlandFragile and conflict affected situationsFranceFrench PolynesiaGabonGambia, TheGeorgiaGermanyGhanaGreeceGreenlandGrenadaGuamGuatemalaGuineaGuinea-BissauGuyanaHaitiHeavily indebted poor countries (HIPC)High incomeHondurasHong Kong SAR, ChinaHungaryIBRD onlyIcelandIDA & IBRD totalIDA blendIDA onlyIDA totalIndiaIndonesiaIran, Islamic Rep.IraqIrelandIsle of ManIsraelItalyJamaicaJapanJordanKazakhstanKenyaKiribatiKorea, Dem. People’s Rep.Korea, Rep.KuwaitKyrgyz RepublicLao PDRLate-demographic dividendLatin America & Caribbean Latin America & Caribbean (excluding high income)Latin America & the Caribbean (IDA & IBRD countries)LatviaLeast developed countries: UN classificationLebanonLesothoLiberiaLibyaLiechtensteinLithuaniaLow & middle incomeLow incomeLower middle incomeLuxembourgMacao SAR, ChinaMacedonia, FYRMadagascarMalawiMalaysiaMaldivesMaliMaltaMarshall IslandsMauritaniaMauritiusMexicoMicronesia, Fed. Sts.Middle East & North AfricaMiddle East & North Africa (excluding high income)Middle East & North Africa (IDA & IBRD countries)Middle incomeMoldovaMongoliaMontenegroMoroccoMozambiqueMyanmarNamibiaNauruNepalNetherlandsNew CaledoniaNew ZealandNicaraguaNigerNigeriaNorth AmericaNorthern Mariana IslandsNorwayOECD membersOmanOther small statesPacific island small statesPakistanPalauPanamaPapua New GuineaParaguayPeruPhilippinesPolandPortugalPost-demographic dividendPre-demographic dividendPuerto RicoQatarRomaniaRussian FederationRwandaSamoaSan MarinoSao Tome and PrincipeSaudi ArabiaSenegalSerbiaSeychellesSierra LeoneSlovak RepublicSloveniaSmall statesSolomon IslandsSomaliaSouth AfricaSouth AsiaSouth Asia (IDA & IBRD)South SudanSpainSri LankaSt. Kitts and NevisSt. LuciaSt. Vincent and the GrenadinesSub-Saharan Africa Sub-Saharan Africa (excluding high income)Sub-Saharan Africa (IDA & IBRD countries)SudanSurinameSwazilandSwedenSwitzerlandSyrian Arab RepublicTajikistanTanzaniaThailandTimor-LesteTogoTongaTrinidad and TobagoTunisiaTurkeyTurkmenistanTurks and Caicos IslandsTuvaluUgandaUkraineUnited Arab EmiratesUnited KingdomUnited StatesUpper middle incomeUruguayUzbekistanVanuatuVenezuela, RBVietnamVirgin Islands (U.S.)West Bank and GazaWorldYemen, Rep.ZambiaZimbabwe Timeline:
This timeline shows a graph from 1961 to 2016 of Pakistan. No data until 1960. Number of actual observations by date: 56.
Source name:
World Development Indicators
Source organization:
World Bank Staff estimates based on United Nations, World Urbanization Prospects.
Categories, topics:
Agriculture & Rural Development
Last updated:
apr 23, 2017
Indicators value changes by year
At the date of observation
Value
Absolute change
Change from previous value
jan 1, 1961
1.658
+1.658
0.0%
jan 1, 1962
1.858
+0.2
12.07%
jan 1, 1963
2.114
+0.256
13.77%
jan 1, 1964
2.168
+0.055
2.58%
jan 1, 1965
2.209
+0.041
1.87%
jan 1, 1966
2.244
+0.035
1.56%
jan 1, 1967
2.274
+0.031
1.38%
jan 1, 1968
2.306
+0.032
1.4%
jan 1, 1969
2.328
+0.022
0.95%
jan 1, 1970
2.341
+0.013
0.54%
jan 1, 1971
2.349
+0.009
0.38%
jan 1, 1972
2.355
+0.005
0.23%
jan 1, 1973
2.368
+0.014
0.57%
jan 1, 1974
2.34
-0.028
-1.2%
jan 1, 1975
2.382
+0.042
1.78%
jan 1, 1976
2.458
+0.077
3.21%
jan 1, 1977
2.527
+0.069
2.8%
jan 1, 1978
2.588
+0.061
2.42%
jan 1, 1979
2.648
+0.06
2.33%
jan 1, 1980
2.71
+0.061
2.32%
jan 1, 1981
2.763
+0.053
1.94%
jan 1, 1982
2.863
+0.1
3.64%
jan 1, 1983
3.0
+0.137
4.79%
jan 1, 1984
3.007
+0.007
0.25%
jan 1, 1985
2.987
-0.021
-0.69%
jan 1, 1986
2.946
-0.041
-1.37%
jan 1, 1987
2.901
-0.044
-1.5%
jan 1, 1988
2.85
-0.051
-1.77%
jan 1, 1989
2.771
-0.079
-2.77%
jan 1, 1990
2.666
-0.105
-3.78%
jan 1, 1991
2.543
-0.123
-4.62%
jan 1, 1992
2.413
-0.13
-5.11%
jan 1, 1993
2.296
-0.117
-4.86%
jan 1, 1994
2.209
-0.087
-3.81%
jan 1, 1995
2.159
-0.049
-2.23%
jan 1, 1996
2.135
-0.025
-1.15%
jan 1, 1997
2.119
-0.015
-0.72%
jan 1, 1998
2.096
-0.023
-1.1%
jan 1, 1999
2.048
-0.048
-2.27%
jan 1, 2000
1.954
-0.094
-4.61%
jan 1, 2001
1.843
-0.111
-5.7%
jan 1, 2002
1.733
-0.11
-5.96%
jan 1, 2003
1.636
-0.097
-5.58%
jan 1, 2004
1.568
-0.068
-4.17%
jan 1, 2005
1.531
-0.037
-2.37%
jan 1, 2006
1.518
-0.013
-0.83%
jan 1, 2007
1.507
-0.011
-0.72%
jan 1, 2008
1.492
-0.015
-1.0%
jan 1, 2009
1.481
-0.01
-0.7%
jan 1, 2010
1.476
-0.005
-0.37%
jan 1, 2011
1.469
-0.007
-0.45%
jan 1, 2012
1.463
-0.007
-0.46%
jan 1, 2013
1.45
-0.012
-0.85%
jan 1, 2014
1.427
-0.023
-1.61%
jan 1, 2015
1.388
-0.039
-2.73%
jan 1, 2016
1.335
-0.053
-3.8%
Ranking of countries by current statistics by years


Comments: