29
/
en
AIzaSyAYiBZKx7MnpbEhh9jyipgxe19OcubqV5w
April 1, 2024
174766
Lao PDR
LAO
true
2
1
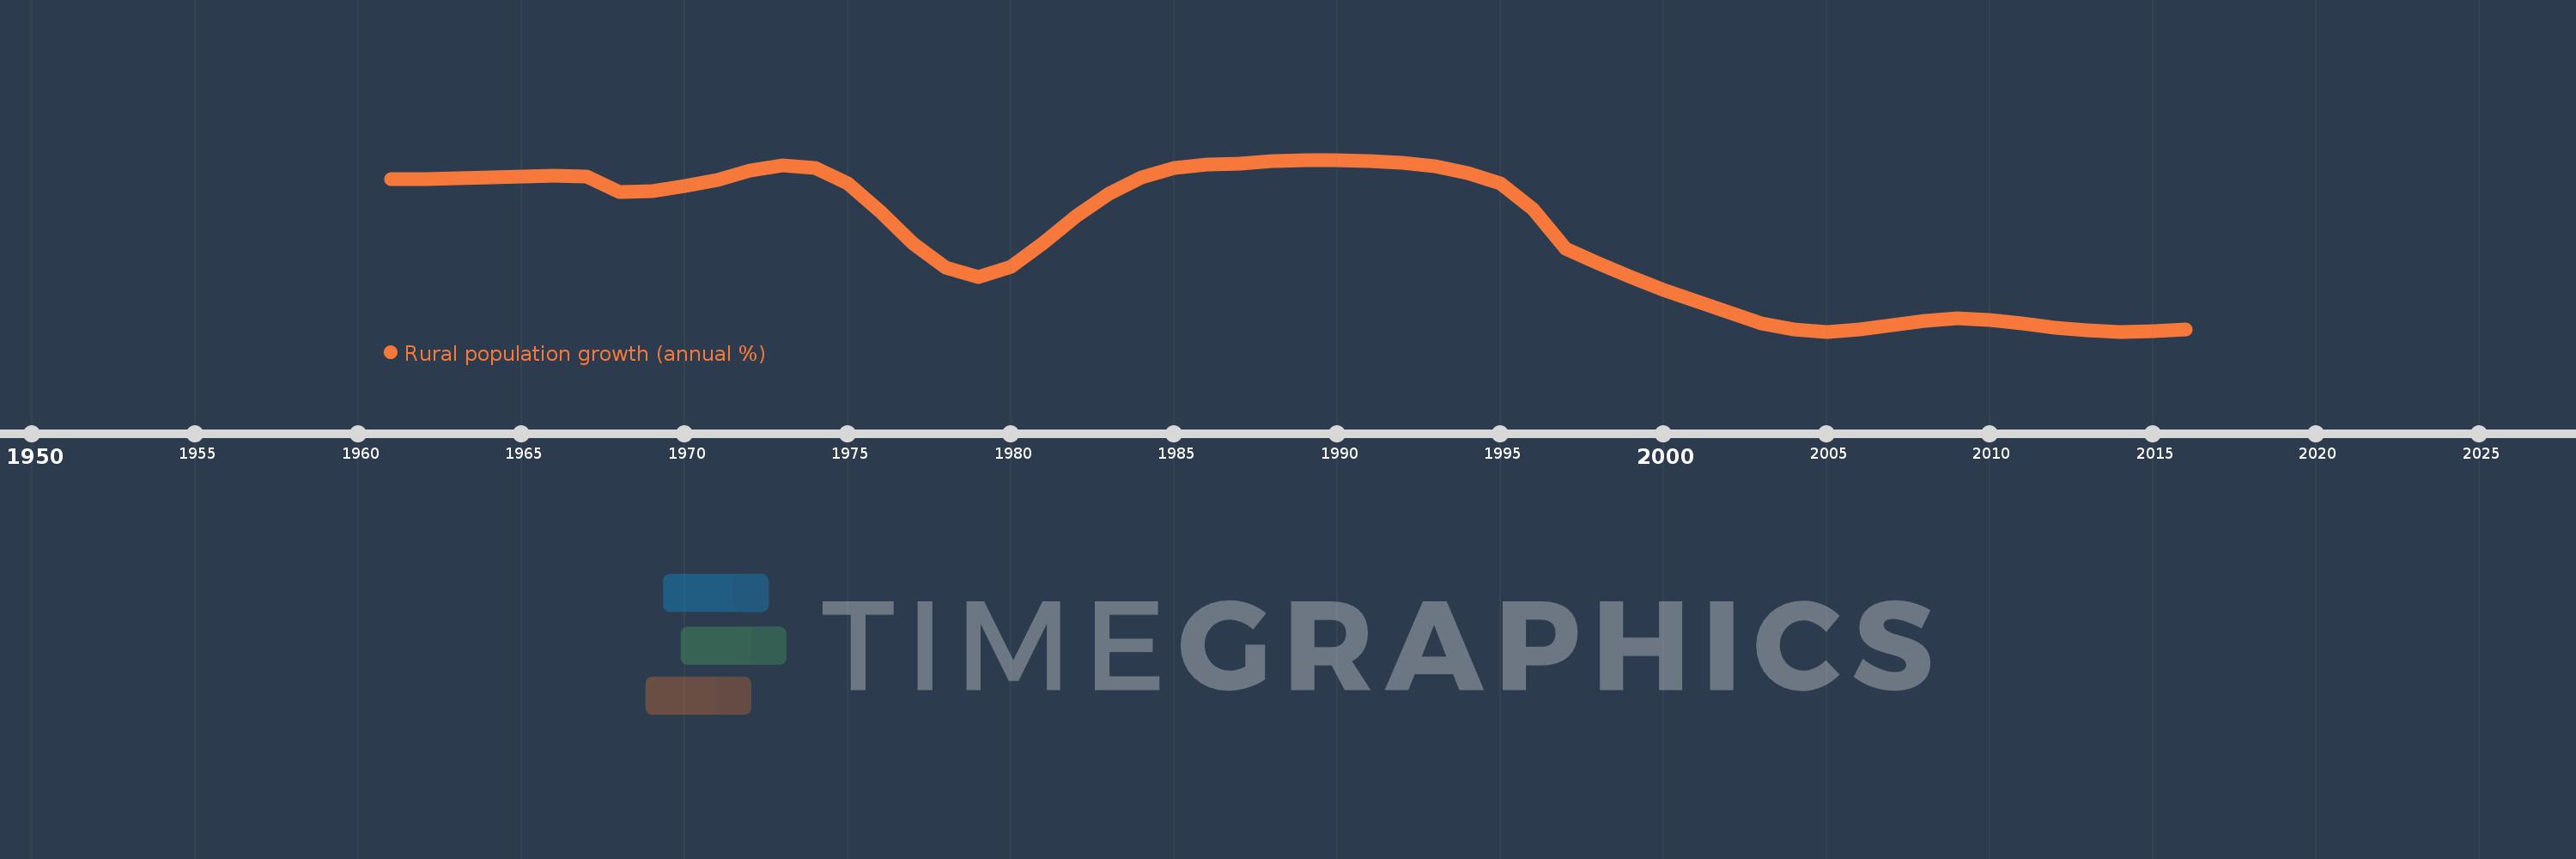
Rural population growth (annual %)
2016,2015,2014,2013,2012,2011,2010,2009,2008,2007,2006,2005,2004,2003,2002,2001,2000,1999,1998,1997,1996,1995,1994,1993,1992,1991,1990,1989,1988,1987,1986,1985,1984,1983,1982,1981,1980,1979,1978,1977,1976,1975,1974,1973,1972,1971,1970,1969,1968,1967,1966,1965,1964,1963,1962,1961
This statistics in other country:
AfghanistanAlbaniaAlgeriaAmerican SamoaAndorraAngolaAntigua and BarbudaArab WorldArgentinaArmeniaArubaAustraliaAustriaAzerbaijanBahamas, TheBahrainBangladeshBarbadosBelarusBelgiumBelizeBeninBhutanBoliviaBosnia and HerzegovinaBotswanaBrazilBritish Virgin IslandsBrunei DarussalamBulgariaBurkina FasoBurundiCabo VerdeCambodiaCameroonCanadaCaribbean small statesCentral African RepublicCentral Europe and the BalticsChadChannel IslandsChileChinaColombiaComorosCongo, Dem. Rep.Congo, Rep.Costa RicaCote d'IvoireCroatiaCubaCuracaoCyprusCzech RepublicDenmarkDjiboutiDominicaDominican RepublicEarly-demographic dividendEast Asia & PacificEast Asia & Pacific (excluding high income)East Asia & Pacific (IDA & IBRD countries)EcuadorEgypt, Arab Rep.El SalvadorEquatorial GuineaEritreaEstoniaEthiopiaEuro areaEurope & Central AsiaEurope & Central Asia (excluding high income)Europe & Central Asia (IDA & IBRD countries)European UnionFaroe IslandsFijiFinlandFragile and conflict affected situationsFranceFrench PolynesiaGabonGambia, TheGeorgiaGermanyGhanaGreeceGreenlandGrenadaGuamGuatemalaGuineaGuinea-BissauGuyanaHaitiHeavily indebted poor countries (HIPC)High incomeHondurasHong Kong SAR, ChinaHungaryIBRD onlyIcelandIDA & IBRD totalIDA blendIDA onlyIDA totalIndiaIndonesiaIran, Islamic Rep.IraqIrelandIsle of ManIsraelItalyJamaicaJapanJordanKazakhstanKenyaKiribatiKorea, Dem. People’s Rep.Korea, Rep.KuwaitKyrgyz RepublicLao PDRLate-demographic dividendLatin America & Caribbean Latin America & Caribbean (excluding high income)Latin America & the Caribbean (IDA & IBRD countries)LatviaLeast developed countries: UN classificationLebanonLesothoLiberiaLibyaLiechtensteinLithuaniaLow & middle incomeLow incomeLower middle incomeLuxembourgMacao SAR, ChinaMacedonia, FYRMadagascarMalawiMalaysiaMaldivesMaliMaltaMarshall IslandsMauritaniaMauritiusMexicoMicronesia, Fed. Sts.Middle East & North AfricaMiddle East & North Africa (excluding high income)Middle East & North Africa (IDA & IBRD countries)Middle incomeMoldovaMongoliaMontenegroMoroccoMozambiqueMyanmarNamibiaNauruNepalNetherlandsNew CaledoniaNew ZealandNicaraguaNigerNigeriaNorth AmericaNorthern Mariana IslandsNorwayOECD membersOmanOther small statesPacific island small statesPakistanPalauPanamaPapua New GuineaParaguayPeruPhilippinesPolandPortugalPost-demographic dividendPre-demographic dividendPuerto RicoQatarRomaniaRussian FederationRwandaSamoaSan MarinoSao Tome and PrincipeSaudi ArabiaSenegalSerbiaSeychellesSierra LeoneSlovak RepublicSloveniaSmall statesSolomon IslandsSomaliaSouth AfricaSouth AsiaSouth Asia (IDA & IBRD)South SudanSpainSri LankaSt. Kitts and NevisSt. LuciaSt. Vincent and the GrenadinesSub-Saharan Africa Sub-Saharan Africa (excluding high income)Sub-Saharan Africa (IDA & IBRD countries)SudanSurinameSwazilandSwedenSwitzerlandSyrian Arab RepublicTajikistanTanzaniaThailandTimor-LesteTogoTongaTrinidad and TobagoTunisiaTurkeyTurkmenistanTurks and Caicos IslandsTuvaluUgandaUkraineUnited Arab EmiratesUnited KingdomUnited StatesUpper middle incomeUruguayUzbekistanVanuatuVenezuela, RBVietnamVirgin Islands (U.S.)West Bank and GazaWorldYemen, Rep.ZambiaZimbabwe Timeline:
This timeline shows a graph from 1961 to 2016 of Lao PDR. No data until 1960. Number of actual observations by date: 56.
Source name:
World Development Indicators
Source organization:
World Bank Staff estimates based on United Nations, World Urbanization Prospects.
Categories, topics:
Agriculture & Rural Development
Last updated:
apr 23, 2017
Indicators value changes by year
At the date of observation
Value
Absolute change
Change from previous value
jan 1, 1961
2.216
+2.216
0.0%
jan 1, 1962
2.22
+0.005
0.21%
jan 1, 1963
2.228
+0.007
0.32%
jan 1, 1964
2.239
+0.011
0.5%
jan 1, 1965
2.252
+0.013
0.58%
jan 1, 1966
2.267
+0.015
0.68%
jan 1, 1967
2.26
-0.007
-0.32%
jan 1, 1968
2.015
-0.245
-10.83%
jan 1, 1969
2.035
+0.02
1.0%
jan 1, 1970
2.11
+0.075
3.69%
jan 1, 1971
2.201
+0.091
4.32%
jan 1, 1972
2.338
+0.137
6.2%
jan 1, 1973
2.421
+0.083
3.55%
jan 1, 1974
2.38
-0.04
-1.67%
jan 1, 1975
2.15
-0.23
-9.68%
jan 1, 1976
1.725
-0.425
-19.77%
jan 1, 1977
1.251
-0.474
-27.46%
jan 1, 1978
0.888
-0.363
-29.0%
jan 1, 1979
0.744
-0.144
-16.25%
jan 1, 1980
0.898
+0.154
20.67%
jan 1, 1981
1.255
+0.357
39.78%
jan 1, 1982
1.663
+0.408
32.49%
jan 1, 1983
1.989
+0.327
19.65%
jan 1, 1984
2.243
+0.254
12.75%
jan 1, 1985
2.38
+0.137
6.12%
jan 1, 1986
2.429
+0.049
2.04%
jan 1, 1987
2.45
+0.021
0.88%
jan 1, 1988
2.486
+0.035
1.45%
jan 1, 1989
2.503
+0.017
0.7%
jan 1, 1990
2.506
+0.003
0.11%
jan 1, 1991
2.487
-0.019
-0.74%
jan 1, 1992
2.462
-0.026
-1.03%
jan 1, 1993
2.411
-0.051
-2.07%
jan 1, 1994
2.309
-0.102
-4.23%
jan 1, 1995
2.148
-0.161
-6.99%
jan 1, 1996
1.765
-0.382
-17.79%
jan 1, 1997
1.168
-0.597
-33.84%
jan 1, 1998
0.951
-0.218
-18.62%
jan 1, 1999
0.742
-0.209
-21.99%
jan 1, 2000
0.551
-0.19
-25.65%
jan 1, 2001
0.38
-0.172
-31.14%
jan 1, 2002
0.209
-0.171
-44.93%
jan 1, 2003
0.047
-0.162
-77.59%
jan 1, 2004
-0.051
-0.098
-208.99%
jan 1, 2005
-0.08
-0.029
56.43%
jan 1, 2006
-0.053
+0.027
-33.89%
jan 1, 2007
0.022
+0.075
-141.98%
jan 1, 2008
0.088
+0.066
296.21%
jan 1, 2009
0.115
+0.027
31.06%
jan 1, 2010
0.095
-0.02
-17.34%
jan 1, 2011
0.043
-0.052
-54.89%
jan 1, 2012
-0.018
-0.061
-141.68%
jan 1, 2013
-0.059
-0.041
227.63%
jan 1, 2014
-0.08
-0.021
35.93%
jan 1, 2015
-0.07
+0.01
-12.03%
jan 1, 2016
-0.046
+0.024
-34.72%
Ranking of countries by current statistics by years


Comments: