29
/
en
AIzaSyAYiBZKx7MnpbEhh9jyipgxe19OcubqV5w
April 1, 2024
193651
Mauritania
MRT
true
2
1
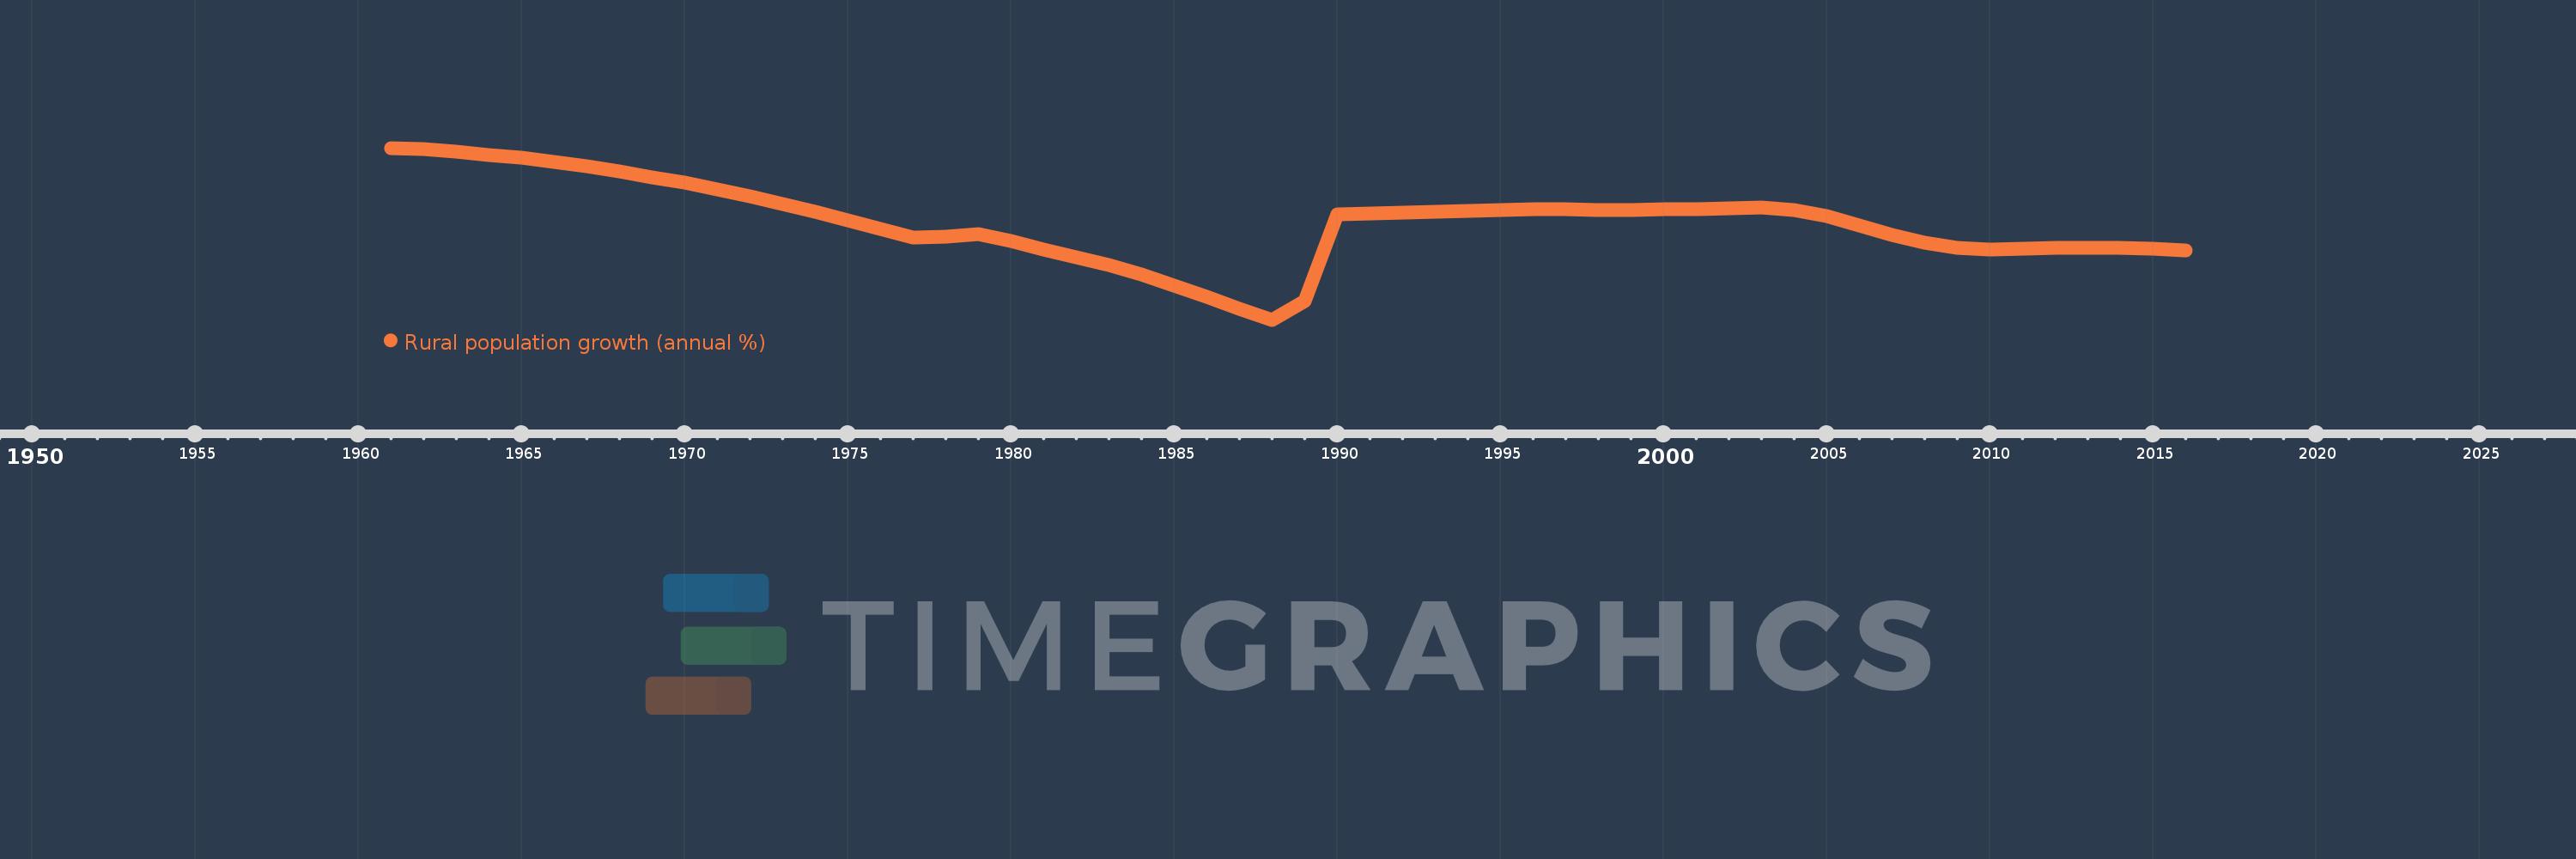
Rural population growth (annual %)
2016,2015,2014,2013,2012,2011,2010,2009,2008,2007,2006,2005,2004,2003,2002,2001,2000,1999,1998,1997,1996,1995,1994,1993,1992,1991,1990,1989,1988,1987,1986,1985,1984,1983,1982,1981,1980,1979,1978,1977,1976,1975,1974,1973,1972,1971,1970,1969,1968,1967,1966,1965,1964,1963,1962,1961
This statistics in other country:
AfghanistanAlbaniaAlgeriaAmerican SamoaAndorraAngolaAntigua and BarbudaArab WorldArgentinaArmeniaArubaAustraliaAustriaAzerbaijanBahamas, TheBahrainBangladeshBarbadosBelarusBelgiumBelizeBeninBhutanBoliviaBosnia and HerzegovinaBotswanaBrazilBritish Virgin IslandsBrunei DarussalamBulgariaBurkina FasoBurundiCabo VerdeCambodiaCameroonCanadaCaribbean small statesCentral African RepublicCentral Europe and the BalticsChadChannel IslandsChileChinaColombiaComorosCongo, Dem. Rep.Congo, Rep.Costa RicaCote d'IvoireCroatiaCubaCuracaoCyprusCzech RepublicDenmarkDjiboutiDominicaDominican RepublicEarly-demographic dividendEast Asia & PacificEast Asia & Pacific (excluding high income)East Asia & Pacific (IDA & IBRD countries)EcuadorEgypt, Arab Rep.El SalvadorEquatorial GuineaEritreaEstoniaEthiopiaEuro areaEurope & Central AsiaEurope & Central Asia (excluding high income)Europe & Central Asia (IDA & IBRD countries)European UnionFaroe IslandsFijiFinlandFragile and conflict affected situationsFranceFrench PolynesiaGabonGambia, TheGeorgiaGermanyGhanaGreeceGreenlandGrenadaGuamGuatemalaGuineaGuinea-BissauGuyanaHaitiHeavily indebted poor countries (HIPC)High incomeHondurasHong Kong SAR, ChinaHungaryIBRD onlyIcelandIDA & IBRD totalIDA blendIDA onlyIDA totalIndiaIndonesiaIran, Islamic Rep.IraqIrelandIsle of ManIsraelItalyJamaicaJapanJordanKazakhstanKenyaKiribatiKorea, Dem. People’s Rep.Korea, Rep.KuwaitKyrgyz RepublicLao PDRLate-demographic dividendLatin America & Caribbean Latin America & Caribbean (excluding high income)Latin America & the Caribbean (IDA & IBRD countries)LatviaLeast developed countries: UN classificationLebanonLesothoLiberiaLibyaLiechtensteinLithuaniaLow & middle incomeLow incomeLower middle incomeLuxembourgMacao SAR, ChinaMacedonia, FYRMadagascarMalawiMalaysiaMaldivesMaliMaltaMarshall IslandsMauritaniaMauritiusMexicoMicronesia, Fed. Sts.Middle East & North AfricaMiddle East & North Africa (excluding high income)Middle East & North Africa (IDA & IBRD countries)Middle incomeMoldovaMongoliaMontenegroMoroccoMozambiqueMyanmarNamibiaNauruNepalNetherlandsNew CaledoniaNew ZealandNicaraguaNigerNigeriaNorth AmericaNorthern Mariana IslandsNorwayOECD membersOmanOther small statesPacific island small statesPakistanPalauPanamaPapua New GuineaParaguayPeruPhilippinesPolandPortugalPost-demographic dividendPre-demographic dividendPuerto RicoQatarRomaniaRussian FederationRwandaSamoaSan MarinoSao Tome and PrincipeSaudi ArabiaSenegalSerbiaSeychellesSierra LeoneSlovak RepublicSloveniaSmall statesSolomon IslandsSomaliaSouth AfricaSouth AsiaSouth Asia (IDA & IBRD)South SudanSpainSri LankaSt. Kitts and NevisSt. LuciaSt. Vincent and the GrenadinesSub-Saharan Africa Sub-Saharan Africa (excluding high income)Sub-Saharan Africa (IDA & IBRD countries)SudanSurinameSwazilandSwedenSwitzerlandSyrian Arab RepublicTajikistanTanzaniaThailandTimor-LesteTogoTongaTrinidad and TobagoTunisiaTurkeyTurkmenistanTurks and Caicos IslandsTuvaluUgandaUkraineUnited Arab EmiratesUnited KingdomUnited StatesUpper middle incomeUruguayUzbekistanVanuatuVenezuela, RBVietnamVirgin Islands (U.S.)West Bank and GazaWorldYemen, Rep.ZambiaZimbabwe Timeline:
This timeline shows a graph from 1961 to 2016 of Mauritania. No data until 1960. Number of actual observations by date: 56.
Source name:
World Development Indicators
Source organization:
World Bank Staff estimates based on United Nations, World Urbanization Prospects.
Categories, topics:
Agriculture & Rural Development
Last updated:
apr 23, 2017
Indicators value changes by year
At the date of observation
Value
Absolute change
Change from previous value
jan 1, 1962
2.28
-0.021
-0.9%
jan 1, 1963
2.25
-0.03
-1.32%
jan 1, 1964
2.211
-0.038
-1.71%
jan 1, 1965
2.166
-0.046
-2.06%
jan 1, 1966
2.115
-0.051
-2.36%
jan 1, 1967
2.055
-0.06
-2.83%
jan 1, 1968
1.987
-0.068
-3.29%
jan 1, 1969
1.913
-0.074
-3.71%
jan 1, 1970
1.838
-0.075
-3.94%
jan 1, 1971
1.75
-0.088
-4.81%
jan 1, 1972
1.657
-0.093
-5.3%
jan 1, 1973
1.556
-0.101
-6.08%
jan 1, 1974
1.457
-0.099
-6.35%
jan 1, 1975
1.346
-0.111
-7.62%
jan 1, 1976
1.233
-0.113
-8.38%
jan 1, 1977
1.109
-0.125
-10.1%
jan 1, 1978
1.128
+0.02
1.76%
jan 1, 1979
1.164
+0.036
3.17%
jan 1, 1980
1.063
-0.101
-8.67%
jan 1, 1981
0.958
-0.106
-9.94%
jan 1, 1982
0.858
-0.099
-10.37%
jan 1, 1983
0.747
-0.111
-12.93%
jan 1, 1984
0.624
-0.124
-16.54%
jan 1, 1985
0.478
-0.146
-23.33%
jan 1, 1986
0.331
-0.147
-30.84%
jan 1, 1987
0.171
-0.159
-48.21%
jan 1, 1988
0.026
-0.145
-84.78%
jan 1, 1989
0.268
+0.242
928.49%
jan 1, 1990
1.424
+1.156
431.18%
jan 1, 1991
1.434
+0.01
0.71%
jan 1, 1992
1.447
+0.012
0.87%
jan 1, 1993
1.456
+0.009
0.64%
jan 1, 1994
1.469
+0.013
0.91%
jan 1, 1995
1.476
+0.007
0.47%
jan 1, 1996
1.486
+0.01
0.66%
jan 1, 1997
1.485
-0.002
-0.1%
jan 1, 1998
1.481
-0.003
-0.21%
jan 1, 1999
1.481
-0.001
-0.05%
jan 1, 2000
1.488
+0.007
0.48%
jan 1, 2001
1.489
+0.001
0.05%
jan 1, 2002
1.503
+0.014
0.97%
jan 1, 2003
1.512
+0.009
0.62%
jan 1, 2004
1.478
-0.034
-2.28%
jan 1, 2005
1.393
-0.084
-5.7%
jan 1, 2006
1.277
-0.116
-8.33%
jan 1, 2007
1.153
-0.125
-9.77%
jan 1, 2008
1.048
-0.105
-9.09%
jan 1, 2009
0.981
-0.067
-6.41%
jan 1, 2010
0.955
-0.026
-2.61%
jan 1, 2011
0.961
+0.006
0.6%
jan 1, 2012
0.975
+0.014
1.49%
jan 1, 2013
0.976
+0.0
0.05%
jan 1, 2014
0.974
-0.001
-0.15%
jan 1, 2015
0.965
-0.01
-0.98%
jan 1, 2016
0.944
-0.021
-2.16%
Ranking of countries by current statistics by years


Comments: