29
/
en
AIzaSyAYiBZKx7MnpbEhh9jyipgxe19OcubqV5w
April 1, 2024
153979
Iceland
ISL
true
2
1
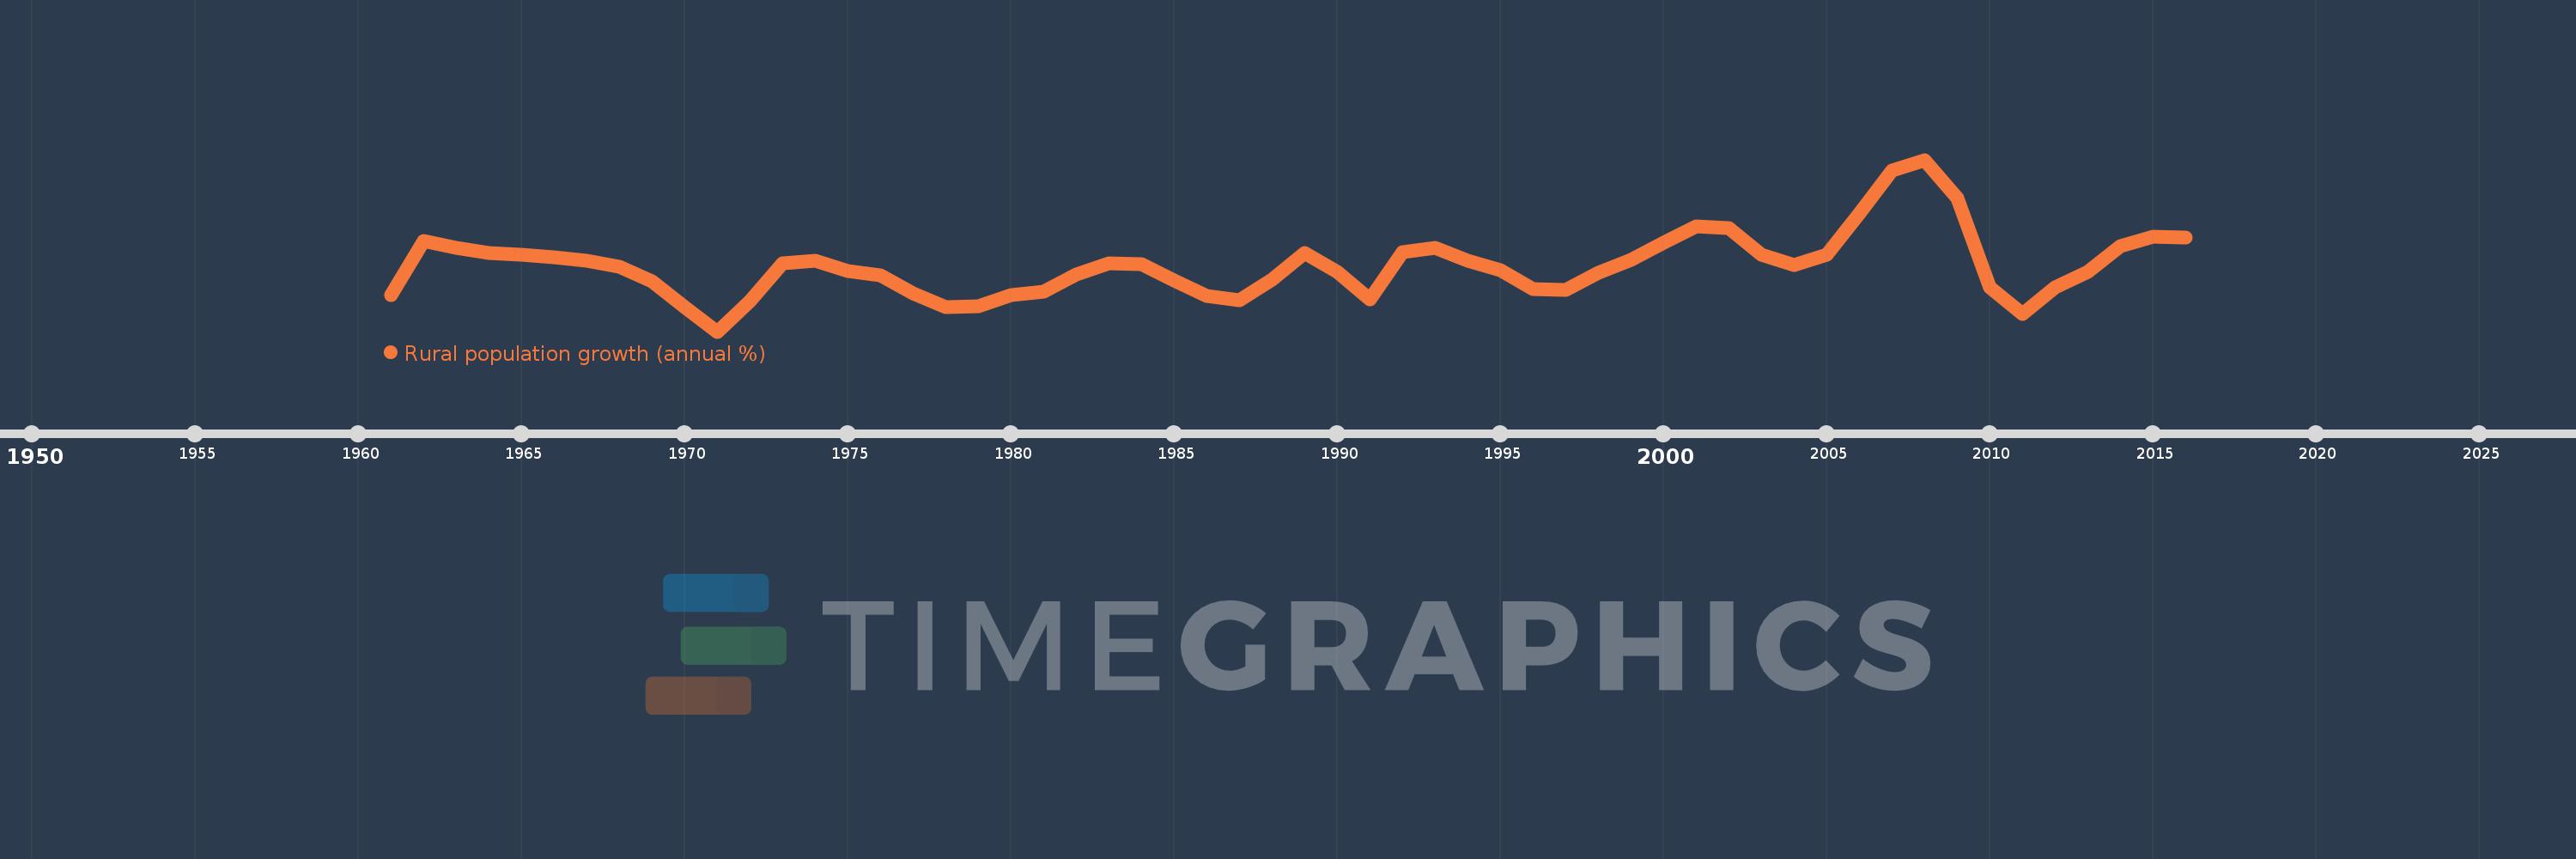
Rural population growth (annual %)
2016,2015,2014,2013,2012,2011,2010,2009,2008,2007,2006,2005,2004,2003,2002,2001,2000,1999,1998,1997,1996,1995,1994,1993,1992,1991,1990,1989,1988,1987,1986,1985,1984,1983,1982,1981,1980,1979,1978,1977,1976,1975,1974,1973,1972,1971,1970,1969,1968,1967,1966,1965,1964,1963,1962,1961
This statistics in other country:
AfghanistanAlbaniaAlgeriaAmerican SamoaAndorraAngolaAntigua and BarbudaArab WorldArgentinaArmeniaArubaAustraliaAustriaAzerbaijanBahamas, TheBahrainBangladeshBarbadosBelarusBelgiumBelizeBeninBhutanBoliviaBosnia and HerzegovinaBotswanaBrazilBritish Virgin IslandsBrunei DarussalamBulgariaBurkina FasoBurundiCabo VerdeCambodiaCameroonCanadaCaribbean small statesCentral African RepublicCentral Europe and the BalticsChadChannel IslandsChileChinaColombiaComorosCongo, Dem. Rep.Congo, Rep.Costa RicaCote d'IvoireCroatiaCubaCuracaoCyprusCzech RepublicDenmarkDjiboutiDominicaDominican RepublicEarly-demographic dividendEast Asia & PacificEast Asia & Pacific (excluding high income)East Asia & Pacific (IDA & IBRD countries)EcuadorEgypt, Arab Rep.El SalvadorEquatorial GuineaEritreaEstoniaEthiopiaEuro areaEurope & Central AsiaEurope & Central Asia (excluding high income)Europe & Central Asia (IDA & IBRD countries)European UnionFaroe IslandsFijiFinlandFragile and conflict affected situationsFranceFrench PolynesiaGabonGambia, TheGeorgiaGermanyGhanaGreeceGreenlandGrenadaGuamGuatemalaGuineaGuinea-BissauGuyanaHaitiHeavily indebted poor countries (HIPC)High incomeHondurasHong Kong SAR, ChinaHungaryIBRD onlyIcelandIDA & IBRD totalIDA blendIDA onlyIDA totalIndiaIndonesiaIran, Islamic Rep.IraqIrelandIsle of ManIsraelItalyJamaicaJapanJordanKazakhstanKenyaKiribatiKorea, Dem. People’s Rep.Korea, Rep.KuwaitKyrgyz RepublicLao PDRLate-demographic dividendLatin America & Caribbean Latin America & Caribbean (excluding high income)Latin America & the Caribbean (IDA & IBRD countries)LatviaLeast developed countries: UN classificationLebanonLesothoLiberiaLibyaLiechtensteinLithuaniaLow & middle incomeLow incomeLower middle incomeLuxembourgMacao SAR, ChinaMacedonia, FYRMadagascarMalawiMalaysiaMaldivesMaliMaltaMarshall IslandsMauritaniaMauritiusMexicoMicronesia, Fed. Sts.Middle East & North AfricaMiddle East & North Africa (excluding high income)Middle East & North Africa (IDA & IBRD countries)Middle incomeMoldovaMongoliaMontenegroMoroccoMozambiqueMyanmarNamibiaNauruNepalNetherlandsNew CaledoniaNew ZealandNicaraguaNigerNigeriaNorth AmericaNorthern Mariana IslandsNorwayOECD membersOmanOther small statesPacific island small statesPakistanPalauPanamaPapua New GuineaParaguayPeruPhilippinesPolandPortugalPost-demographic dividendPre-demographic dividendPuerto RicoQatarRomaniaRussian FederationRwandaSamoaSan MarinoSao Tome and PrincipeSaudi ArabiaSenegalSerbiaSeychellesSierra LeoneSlovak RepublicSloveniaSmall statesSolomon IslandsSomaliaSouth AfricaSouth AsiaSouth Asia (IDA & IBRD)South SudanSpainSri LankaSt. Kitts and NevisSt. LuciaSt. Vincent and the GrenadinesSub-Saharan Africa Sub-Saharan Africa (excluding high income)Sub-Saharan Africa (IDA & IBRD countries)SudanSurinameSwazilandSwedenSwitzerlandSyrian Arab RepublicTajikistanTanzaniaThailandTimor-LesteTogoTongaTrinidad and TobagoTunisiaTurkeyTurkmenistanTurks and Caicos IslandsTuvaluUgandaUkraineUnited Arab EmiratesUnited KingdomUnited StatesUpper middle incomeUruguayUzbekistanVanuatuVenezuela, RBVietnamVirgin Islands (U.S.)West Bank and GazaWorldYemen, Rep.ZambiaZimbabwe Timeline:
This timeline shows a graph from 1961 to 2016 of Iceland. No data until 1960. Number of actual observations by date: 56.
Source name:
World Development Indicators
Source organization:
World Bank Staff estimates based on United Nations, World Urbanization Prospects.
Categories, topics:
Agriculture & Rural Development
Last updated:
apr 23, 2017
Indicators value changes by year
Minimum:
-2.201
jan 1, 1971
At the date of observation
Value
Absolute change
Change from previous value
jan 1, 1961
-1.575
-1.575
0.0%
jan 1, 1962
-0.638
+0.937
-59.48%
jan 1, 1963
-0.754
-0.115
18.09%
jan 1, 1964
-0.842
-0.088
11.74%
jan 1, 1965
-0.864
-0.022
2.62%
jan 1, 1966
-0.917
-0.053
6.1%
jan 1, 1967
-0.974
-0.057
6.23%
jan 1, 1968
-1.076
-0.102
10.44%
jan 1, 1969
-1.33
-0.254
23.64%
jan 1, 1970
-1.778
-0.448
33.69%
jan 1, 1971
-2.201
-0.423
23.82%
jan 1, 1972
-1.666
+0.535
-24.31%
jan 1, 1973
-1.016
+0.65
-38.99%
jan 1, 1974
-0.98
+0.037
-3.6%
jan 1, 1975
-1.152
-0.173
17.63%
jan 1, 1976
-1.231
-0.079
6.84%
jan 1, 1977
-1.536
-0.305
24.77%
jan 1, 1978
-1.781
-0.244
15.9%
jan 1, 1979
-1.762
+0.018
-1.03%
jan 1, 1980
-1.569
+0.193
-10.95%
jan 1, 1981
-1.508
+0.061
-3.88%
jan 1, 1982
-1.21
+0.299
-19.8%
jan 1, 1983
-1.022
+0.188
-15.52%
jan 1, 1984
-1.04
-0.018
1.79%
jan 1, 1985
-1.316
-0.276
26.57%
jan 1, 1986
-1.588
-0.271
20.62%
jan 1, 1987
-1.658
-0.07
4.41%
jan 1, 1988
-1.296
+0.361
-21.8%
jan 1, 1989
-0.846
+0.45
-34.73%
jan 1, 1990
-1.162
-0.316
37.29%
jan 1, 1991
-1.637
-0.475
40.89%
jan 1, 1992
-0.826
+0.81
-49.51%
jan 1, 1993
-0.747
+0.079
-9.6%
jan 1, 1994
-0.974
-0.227
30.43%
jan 1, 1995
-1.138
-0.164
16.78%
jan 1, 1996
-1.468
-0.33
28.98%
jan 1, 1997
-1.476
-0.008
0.56%
jan 1, 1998
-1.186
+0.29
-19.67%
jan 1, 1999
-0.954
+0.232
-19.53%
jan 1, 2000
-0.66
+0.294
-30.85%
jan 1, 2001
-0.378
+0.281
-42.66%
jan 1, 2002
-0.413
-0.034
9.07%
jan 1, 2003
-0.864
-0.451
109.29%
jan 1, 2004
-1.053
-0.189
21.93%
jan 1, 2005
-0.871
+0.182
-17.31%
jan 1, 2006
-0.164
+0.706
-81.12%
jan 1, 2007
0.579
+0.744
-452.21%
jan 1, 2008
0.772
+0.193
33.26%
jan 1, 2009
0.105
-0.667
-86.4%
jan 1, 2010
-1.432
-1.537
-1.46K%
jan 1, 2011
-1.9
-0.469
32.73%
jan 1, 2012
-1.435
+0.465
-24.46%
jan 1, 2013
-1.172
+0.263
-18.32%
jan 1, 2014
-0.721
+0.451
-38.48%
jan 1, 2015
-0.552
+0.169
-23.46%
jan 1, 2016
-0.566
-0.013
2.42%
Ranking of countries by current statistics by years


Comments: