29
/
en
AIzaSyAYiBZKx7MnpbEhh9jyipgxe19OcubqV5w
April 1, 2024
203582
Mozambique
MOZ
true
2
1
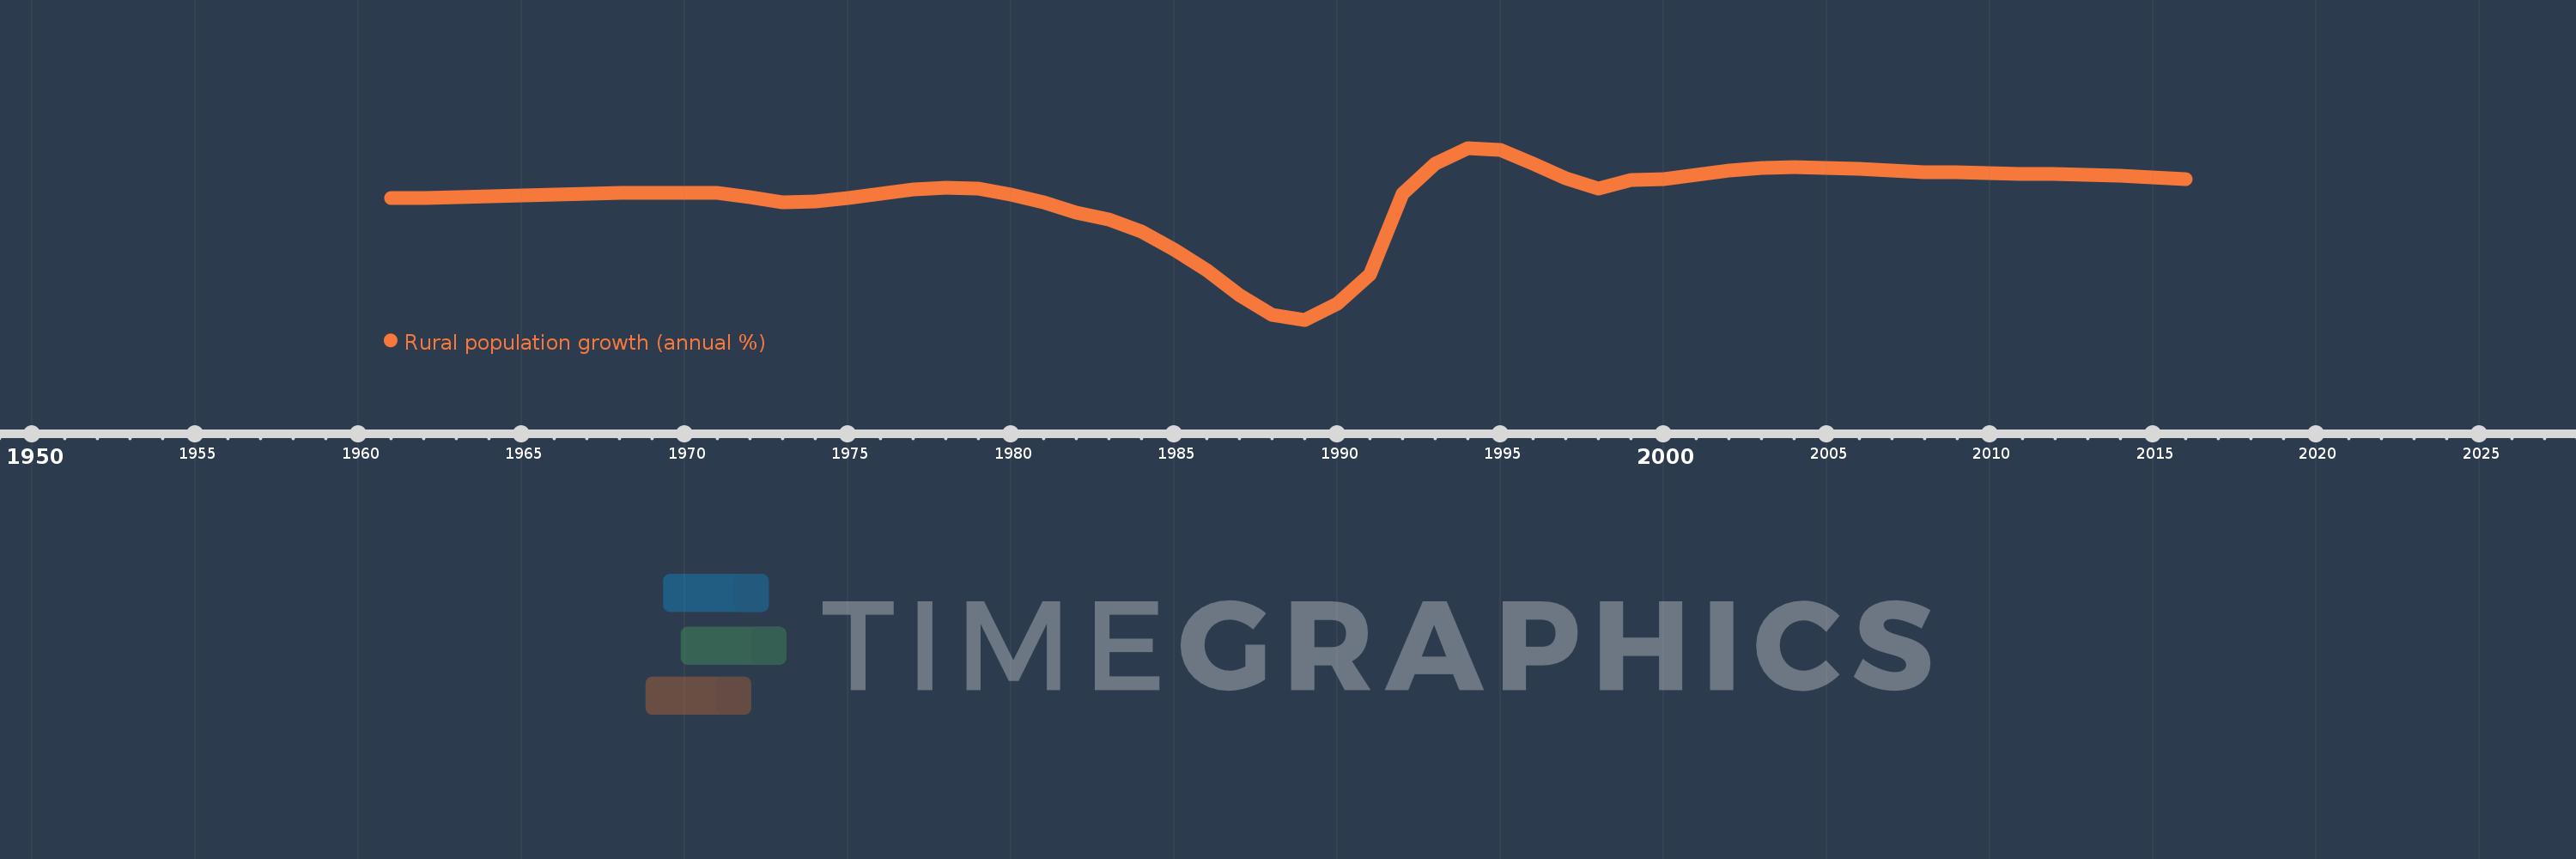
Rural population growth (annual %)
2016,2015,2014,2013,2012,2011,2010,2009,2008,2007,2006,2005,2004,2003,2002,2001,2000,1999,1998,1997,1996,1995,1994,1993,1992,1991,1990,1989,1988,1987,1986,1985,1984,1983,1982,1981,1980,1979,1978,1977,1976,1975,1974,1973,1972,1971,1970,1969,1968,1967,1966,1965,1964,1963,1962,1961
This statistics in other country:
AfghanistanAlbaniaAlgeriaAmerican SamoaAndorraAngolaAntigua and BarbudaArab WorldArgentinaArmeniaArubaAustraliaAustriaAzerbaijanBahamas, TheBahrainBangladeshBarbadosBelarusBelgiumBelizeBeninBhutanBoliviaBosnia and HerzegovinaBotswanaBrazilBritish Virgin IslandsBrunei DarussalamBulgariaBurkina FasoBurundiCabo VerdeCambodiaCameroonCanadaCaribbean small statesCentral African RepublicCentral Europe and the BalticsChadChannel IslandsChileChinaColombiaComorosCongo, Dem. Rep.Congo, Rep.Costa RicaCote d'IvoireCroatiaCubaCuracaoCyprusCzech RepublicDenmarkDjiboutiDominicaDominican RepublicEarly-demographic dividendEast Asia & PacificEast Asia & Pacific (excluding high income)East Asia & Pacific (IDA & IBRD countries)EcuadorEgypt, Arab Rep.El SalvadorEquatorial GuineaEritreaEstoniaEthiopiaEuro areaEurope & Central AsiaEurope & Central Asia (excluding high income)Europe & Central Asia (IDA & IBRD countries)European UnionFaroe IslandsFijiFinlandFragile and conflict affected situationsFranceFrench PolynesiaGabonGambia, TheGeorgiaGermanyGhanaGreeceGreenlandGrenadaGuamGuatemalaGuineaGuinea-BissauGuyanaHaitiHeavily indebted poor countries (HIPC)High incomeHondurasHong Kong SAR, ChinaHungaryIBRD onlyIcelandIDA & IBRD totalIDA blendIDA onlyIDA totalIndiaIndonesiaIran, Islamic Rep.IraqIrelandIsle of ManIsraelItalyJamaicaJapanJordanKazakhstanKenyaKiribatiKorea, Dem. People’s Rep.Korea, Rep.KuwaitKyrgyz RepublicLao PDRLate-demographic dividendLatin America & Caribbean Latin America & Caribbean (excluding high income)Latin America & the Caribbean (IDA & IBRD countries)LatviaLeast developed countries: UN classificationLebanonLesothoLiberiaLibyaLiechtensteinLithuaniaLow & middle incomeLow incomeLower middle incomeLuxembourgMacao SAR, ChinaMacedonia, FYRMadagascarMalawiMalaysiaMaldivesMaliMaltaMarshall IslandsMauritaniaMauritiusMexicoMicronesia, Fed. Sts.Middle East & North AfricaMiddle East & North Africa (excluding high income)Middle East & North Africa (IDA & IBRD countries)Middle incomeMoldovaMongoliaMontenegroMoroccoMozambiqueMyanmarNamibiaNauruNepalNetherlandsNew CaledoniaNew ZealandNicaraguaNigerNigeriaNorth AmericaNorthern Mariana IslandsNorwayOECD membersOmanOther small statesPacific island small statesPakistanPalauPanamaPapua New GuineaParaguayPeruPhilippinesPolandPortugalPost-demographic dividendPre-demographic dividendPuerto RicoQatarRomaniaRussian FederationRwandaSamoaSan MarinoSao Tome and PrincipeSaudi ArabiaSenegalSerbiaSeychellesSierra LeoneSlovak RepublicSloveniaSmall statesSolomon IslandsSomaliaSouth AfricaSouth AsiaSouth Asia (IDA & IBRD)South SudanSpainSri LankaSt. Kitts and NevisSt. LuciaSt. Vincent and the GrenadinesSub-Saharan Africa Sub-Saharan Africa (excluding high income)Sub-Saharan Africa (IDA & IBRD countries)SudanSurinameSwazilandSwedenSwitzerlandSyrian Arab RepublicTajikistanTanzaniaThailandTimor-LesteTogoTongaTrinidad and TobagoTunisiaTurkeyTurkmenistanTurks and Caicos IslandsTuvaluUgandaUkraineUnited Arab EmiratesUnited KingdomUnited StatesUpper middle incomeUruguayUzbekistanVanuatuVenezuela, RBVietnamVirgin Islands (U.S.)West Bank and GazaWorldYemen, Rep.ZambiaZimbabwe Timeline:
This timeline shows a graph from 1961 to 2016 of Mozambique. No data until 1960. Number of actual observations by date: 56.
Source name:
World Development Indicators
Source organization:
World Bank Staff estimates based on United Nations, World Urbanization Prospects.
Categories, topics:
Agriculture & Rural Development
Last updated:
apr 23, 2017
Indicators value changes by year
Minimum:
-1.842
jan 1, 1989
At the date of observation
Value
Absolute change
Change from previous value
jan 1, 1961
1.784
+1.784
0.0%
jan 1, 1962
1.793
+0.009
0.51%
jan 1, 1963
1.816
+0.023
1.31%
jan 1, 1964
1.844
+0.028
1.54%
jan 1, 1965
1.864
+0.019
1.05%
jan 1, 1966
1.882
+0.019
1.0%
jan 1, 1967
1.901
+0.019
1.01%
jan 1, 1968
1.923
+0.021
1.12%
jan 1, 1969
1.936
+0.013
0.67%
jan 1, 1970
1.942
+0.006
0.32%
jan 1, 1971
1.942
+0.0
0.02%
jan 1, 1972
1.796
-0.146
-7.52%
jan 1, 1973
1.659
-0.138
-7.66%
jan 1, 1974
1.68
+0.022
1.31%
jan 1, 1975
1.776
+0.096
5.71%
jan 1, 1976
1.907
+0.131
7.38%
jan 1, 1977
2.03
+0.123
6.43%
jan 1, 1978
2.09
+0.06
2.98%
jan 1, 1979
2.049
-0.041
-1.97%
jan 1, 1980
1.891
-0.158
-7.71%
jan 1, 1981
1.645
-0.246
-13.02%
jan 1, 1982
1.353
-0.292
-17.73%
jan 1, 1983
1.139
-0.214
-15.81%
jan 1, 1984
0.787
-0.352
-30.91%
jan 1, 1985
0.249
-0.538
-68.38%
jan 1, 1986
-0.37
-0.619
-248.72%
jan 1, 1987
-1.101
-0.73
197.34%
jan 1, 1988
-1.693
-0.593
53.84%
jan 1, 1989
-1.842
-0.149
8.78%
jan 1, 1990
-1.367
+0.474
-25.76%
jan 1, 1991
-0.49
+0.877
-64.15%
jan 1, 1992
1.917
+2.407
-491.1%
jan 1, 1993
2.804
+0.887
46.28%
jan 1, 1994
3.271
+0.467
16.65%
jan 1, 1995
3.208
-0.063
-1.93%
jan 1, 1996
2.815
-0.392
-12.23%
jan 1, 1997
2.363
-0.453
-16.08%
jan 1, 1998
2.049
-0.313
-13.26%
jan 1, 1999
2.31
+0.261
12.73%
jan 1, 2000
2.353
+0.043
1.85%
jan 1, 2001
2.471
+0.118
5.03%
jan 1, 2002
2.596
+0.125
5.05%
jan 1, 2003
2.663
+0.067
2.57%
jan 1, 2004
2.697
+0.034
1.29%
jan 1, 2005
2.683
-0.014
-0.53%
jan 1, 2006
2.64
-0.043
-1.59%
jan 1, 2007
2.59
-0.05
-1.89%
jan 1, 2008
2.559
-0.031
-1.19%
jan 1, 2009
2.537
-0.022
-0.88%
jan 1, 2010
2.516
-0.021
-0.82%
jan 1, 2011
2.505
-0.011
-0.43%
jan 1, 2012
2.494
-0.011
-0.43%
jan 1, 2013
2.475
-0.019
-0.76%
jan 1, 2014
2.445
-0.03
-1.22%
jan 1, 2015
2.402
-0.043
-1.75%
jan 1, 2016
2.348
-0.055
-2.28%
Ranking of countries by current statistics by years


Comments: