29
/
en
AIzaSyAYiBZKx7MnpbEhh9jyipgxe19OcubqV5w
April 1, 2024
244188
Solomon Islands
SLB
true
2
1
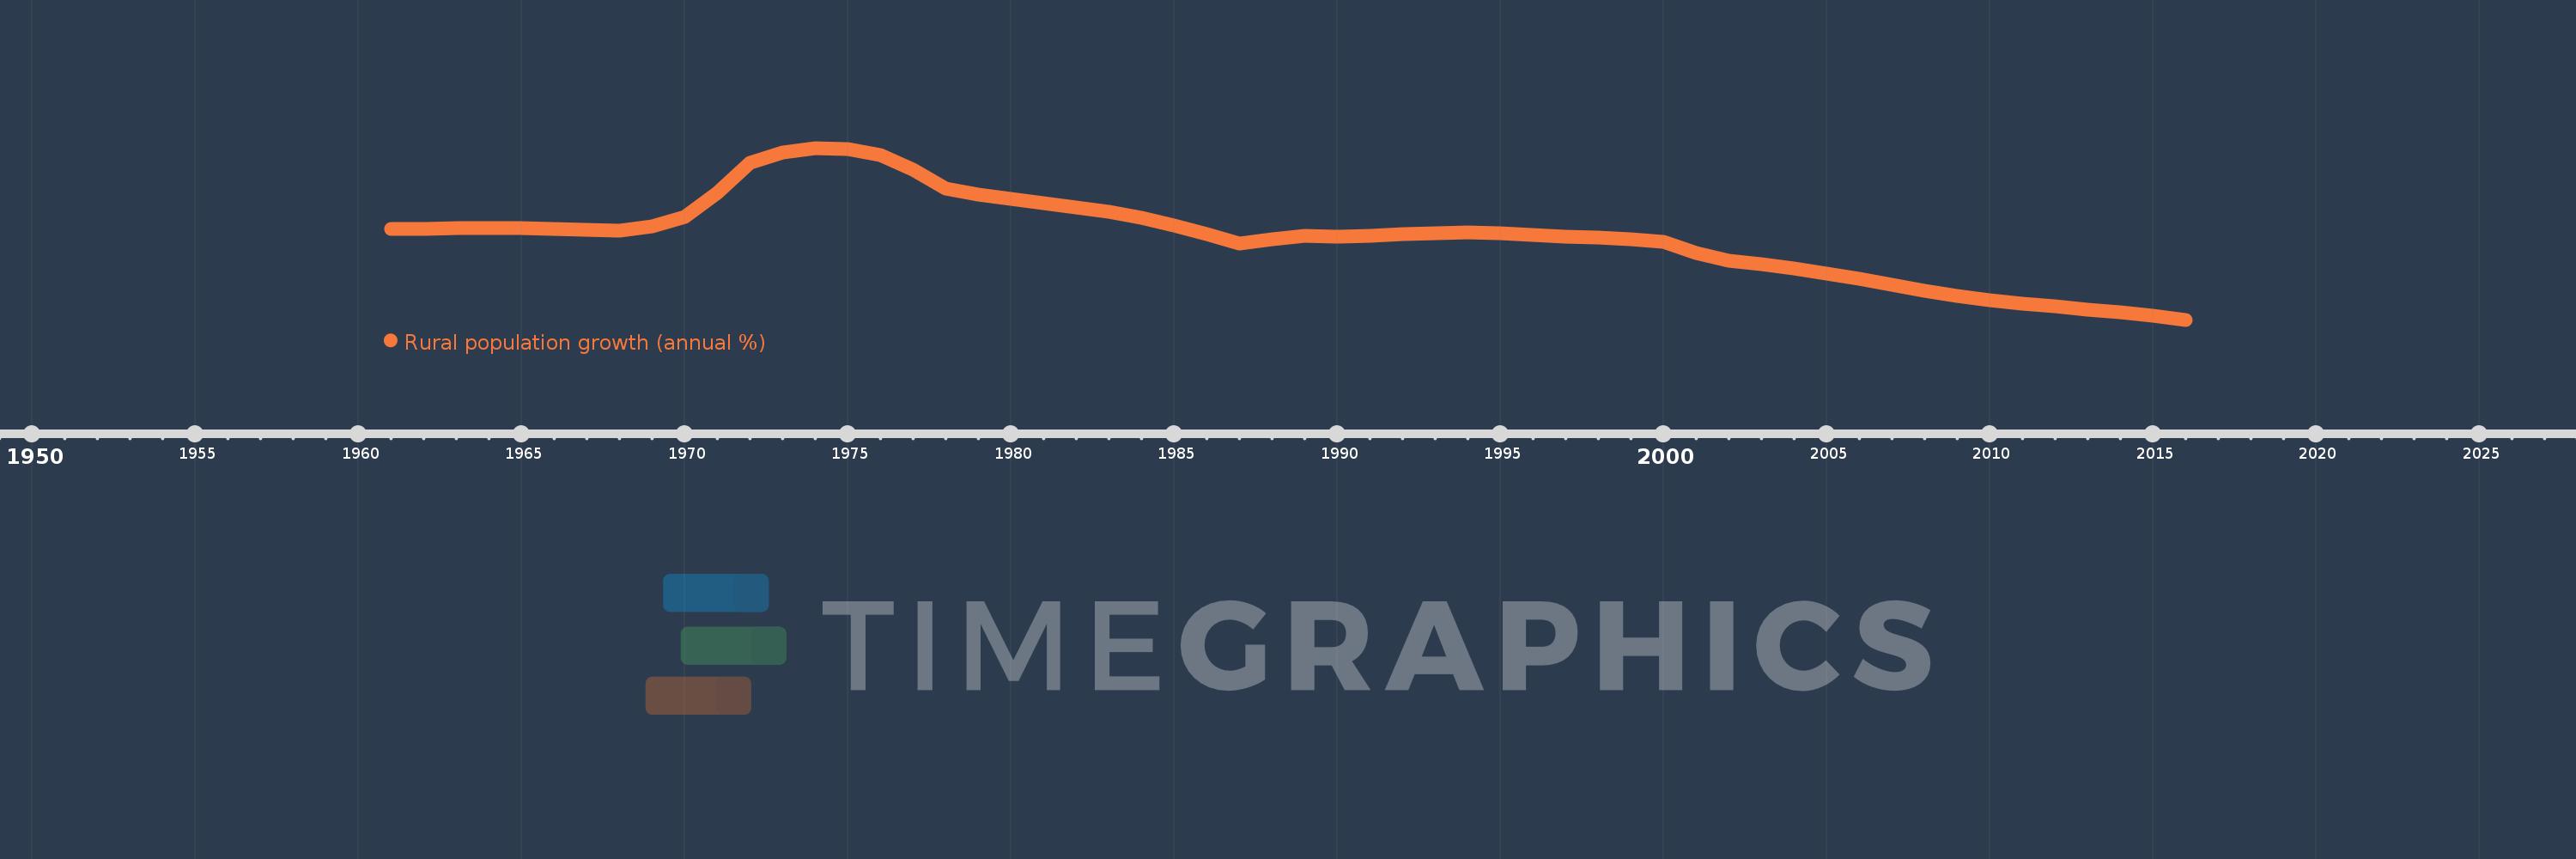
Rural population growth (annual %)
2016,2015,2014,2013,2012,2011,2010,2009,2008,2007,2006,2005,2004,2003,2002,2001,2000,1999,1998,1997,1996,1995,1994,1993,1992,1991,1990,1989,1988,1987,1986,1985,1984,1983,1982,1981,1980,1979,1978,1977,1976,1975,1974,1973,1972,1971,1970,1969,1968,1967,1966,1965,1964,1963,1962,1961
This statistics in other country:
AfghanistanAlbaniaAlgeriaAmerican SamoaAndorraAngolaAntigua and BarbudaArab WorldArgentinaArmeniaArubaAustraliaAustriaAzerbaijanBahamas, TheBahrainBangladeshBarbadosBelarusBelgiumBelizeBeninBhutanBoliviaBosnia and HerzegovinaBotswanaBrazilBritish Virgin IslandsBrunei DarussalamBulgariaBurkina FasoBurundiCabo VerdeCambodiaCameroonCanadaCaribbean small statesCentral African RepublicCentral Europe and the BalticsChadChannel IslandsChileChinaColombiaComorosCongo, Dem. Rep.Congo, Rep.Costa RicaCote d'IvoireCroatiaCubaCuracaoCyprusCzech RepublicDenmarkDjiboutiDominicaDominican RepublicEarly-demographic dividendEast Asia & PacificEast Asia & Pacific (excluding high income)East Asia & Pacific (IDA & IBRD countries)EcuadorEgypt, Arab Rep.El SalvadorEquatorial GuineaEritreaEstoniaEthiopiaEuro areaEurope & Central AsiaEurope & Central Asia (excluding high income)Europe & Central Asia (IDA & IBRD countries)European UnionFaroe IslandsFijiFinlandFragile and conflict affected situationsFranceFrench PolynesiaGabonGambia, TheGeorgiaGermanyGhanaGreeceGreenlandGrenadaGuamGuatemalaGuineaGuinea-BissauGuyanaHaitiHeavily indebted poor countries (HIPC)High incomeHondurasHong Kong SAR, ChinaHungaryIBRD onlyIcelandIDA & IBRD totalIDA blendIDA onlyIDA totalIndiaIndonesiaIran, Islamic Rep.IraqIrelandIsle of ManIsraelItalyJamaicaJapanJordanKazakhstanKenyaKiribatiKorea, Dem. People’s Rep.Korea, Rep.KuwaitKyrgyz RepublicLao PDRLate-demographic dividendLatin America & Caribbean Latin America & Caribbean (excluding high income)Latin America & the Caribbean (IDA & IBRD countries)LatviaLeast developed countries: UN classificationLebanonLesothoLiberiaLibyaLiechtensteinLithuaniaLow & middle incomeLow incomeLower middle incomeLuxembourgMacao SAR, ChinaMacedonia, FYRMadagascarMalawiMalaysiaMaldivesMaliMaltaMarshall IslandsMauritaniaMauritiusMexicoMicronesia, Fed. Sts.Middle East & North AfricaMiddle East & North Africa (excluding high income)Middle East & North Africa (IDA & IBRD countries)Middle incomeMoldovaMongoliaMontenegroMoroccoMozambiqueMyanmarNamibiaNauruNepalNetherlandsNew CaledoniaNew ZealandNicaraguaNigerNigeriaNorth AmericaNorthern Mariana IslandsNorwayOECD membersOmanOther small statesPacific island small statesPakistanPalauPanamaPapua New GuineaParaguayPeruPhilippinesPolandPortugalPost-demographic dividendPre-demographic dividendPuerto RicoQatarRomaniaRussian FederationRwandaSamoaSan MarinoSao Tome and PrincipeSaudi ArabiaSenegalSerbiaSeychellesSierra LeoneSlovak RepublicSloveniaSmall statesSolomon IslandsSomaliaSouth AfricaSouth AsiaSouth Asia (IDA & IBRD)South SudanSpainSri LankaSt. Kitts and NevisSt. LuciaSt. Vincent and the GrenadinesSub-Saharan Africa Sub-Saharan Africa (excluding high income)Sub-Saharan Africa (IDA & IBRD countries)SudanSurinameSwazilandSwedenSwitzerlandSyrian Arab RepublicTajikistanTanzaniaThailandTimor-LesteTogoTongaTrinidad and TobagoTunisiaTurkeyTurkmenistanTurks and Caicos IslandsTuvaluUgandaUkraineUnited Arab EmiratesUnited KingdomUnited StatesUpper middle incomeUruguayUzbekistanVanuatuVenezuela, RBVietnamVirgin Islands (U.S.)West Bank and GazaWorldYemen, Rep.ZambiaZimbabwe Timeline:
This timeline shows a graph from 1961 to 2016 of Solomon Islands. No data until 1960. Number of actual observations by date: 56.
Source name:
World Development Indicators
Source organization:
World Bank Staff estimates based on United Nations, World Urbanization Prospects.
Categories, topics:
Agriculture & Rural Development
Last updated:
apr 23, 2017
Indicators value changes by year
At the date of observation
Value
Absolute change
Change from previous value
jan 1, 1961
2.667
+2.667
0.0%
jan 1, 1962
2.668
+0.001
0.03%
jan 1, 1963
2.672
+0.004
0.15%
jan 1, 1964
2.674
+0.002
0.07%
jan 1, 1965
2.67
-0.004
-0.15%
jan 1, 1966
2.666
-0.004
-0.15%
jan 1, 1967
2.649
-0.017
-0.64%
jan 1, 1968
2.643
-0.006
-0.21%
jan 1, 1969
2.701
+0.058
2.19%
jan 1, 1970
2.835
+0.134
4.97%
jan 1, 1971
3.167
+0.332
11.69%
jan 1, 1972
3.583
+0.416
13.14%
jan 1, 1973
3.724
+0.141
3.94%
jan 1, 1974
3.793
+0.069
1.85%
jan 1, 1975
3.774
-0.019
-0.51%
jan 1, 1976
3.698
-0.076
-2.01%
jan 1, 1977
3.491
-0.207
-5.6%
jan 1, 1978
3.23
-0.261
-7.48%
jan 1, 1979
3.146
-0.084
-2.59%
jan 1, 1980
3.079
-0.067
-2.13%
jan 1, 1981
3.019
-0.06
-1.95%
jan 1, 1982
2.964
-0.055
-1.82%
jan 1, 1983
2.899
-0.065
-2.18%
jan 1, 1984
2.814
-0.085
-2.94%
jan 1, 1985
2.705
-0.109
-3.87%
jan 1, 1986
2.586
-0.119
-4.4%
jan 1, 1987
2.462
-0.124
-4.78%
jan 1, 1988
2.521
+0.059
2.39%
jan 1, 1989
2.567
+0.046
1.81%
jan 1, 1990
2.557
-0.01
-0.39%
jan 1, 1991
2.572
+0.015
0.6%
jan 1, 1992
2.595
+0.023
0.88%
jan 1, 1993
2.607
+0.012
0.47%
jan 1, 1994
2.61
+0.003
0.12%
jan 1, 1995
2.601
-0.01
-0.38%
jan 1, 1996
2.583
-0.018
-0.68%
jan 1, 1997
2.56
-0.023
-0.91%
jan 1, 1998
2.538
-0.021
-0.84%
jan 1, 1999
2.514
-0.024
-0.96%
jan 1, 2000
2.486
-0.027
-1.09%
jan 1, 2001
2.332
-0.154
-6.2%
jan 1, 2002
2.218
-0.114
-4.9%
jan 1, 2003
2.173
-0.045
-2.03%
jan 1, 2004
2.115
-0.058
-2.65%
jan 1, 2005
2.044
-0.072
-3.38%
jan 1, 2006
1.965
-0.079
-3.87%
jan 1, 2007
1.881
-0.083
-4.25%
jan 1, 2008
1.802
-0.079
-4.22%
jan 1, 2009
1.73
-0.072
-3.99%
jan 1, 2010
1.672
-0.058
-3.36%
jan 1, 2011
1.62
-0.052
-3.09%
jan 1, 2012
1.582
-0.038
-2.33%
jan 1, 2013
1.541
-0.041
-2.59%
jan 1, 2014
1.497
-0.044
-2.89%
jan 1, 2015
1.447
-0.05
-3.31%
jan 1, 2016
1.395
-0.052
-3.62%
Ranking of countries by current statistics by years


Comments: