29
/
en
AIzaSyAYiBZKx7MnpbEhh9jyipgxe19OcubqV5w
April 1, 2024
46648
Low income
LIC
false
2
1
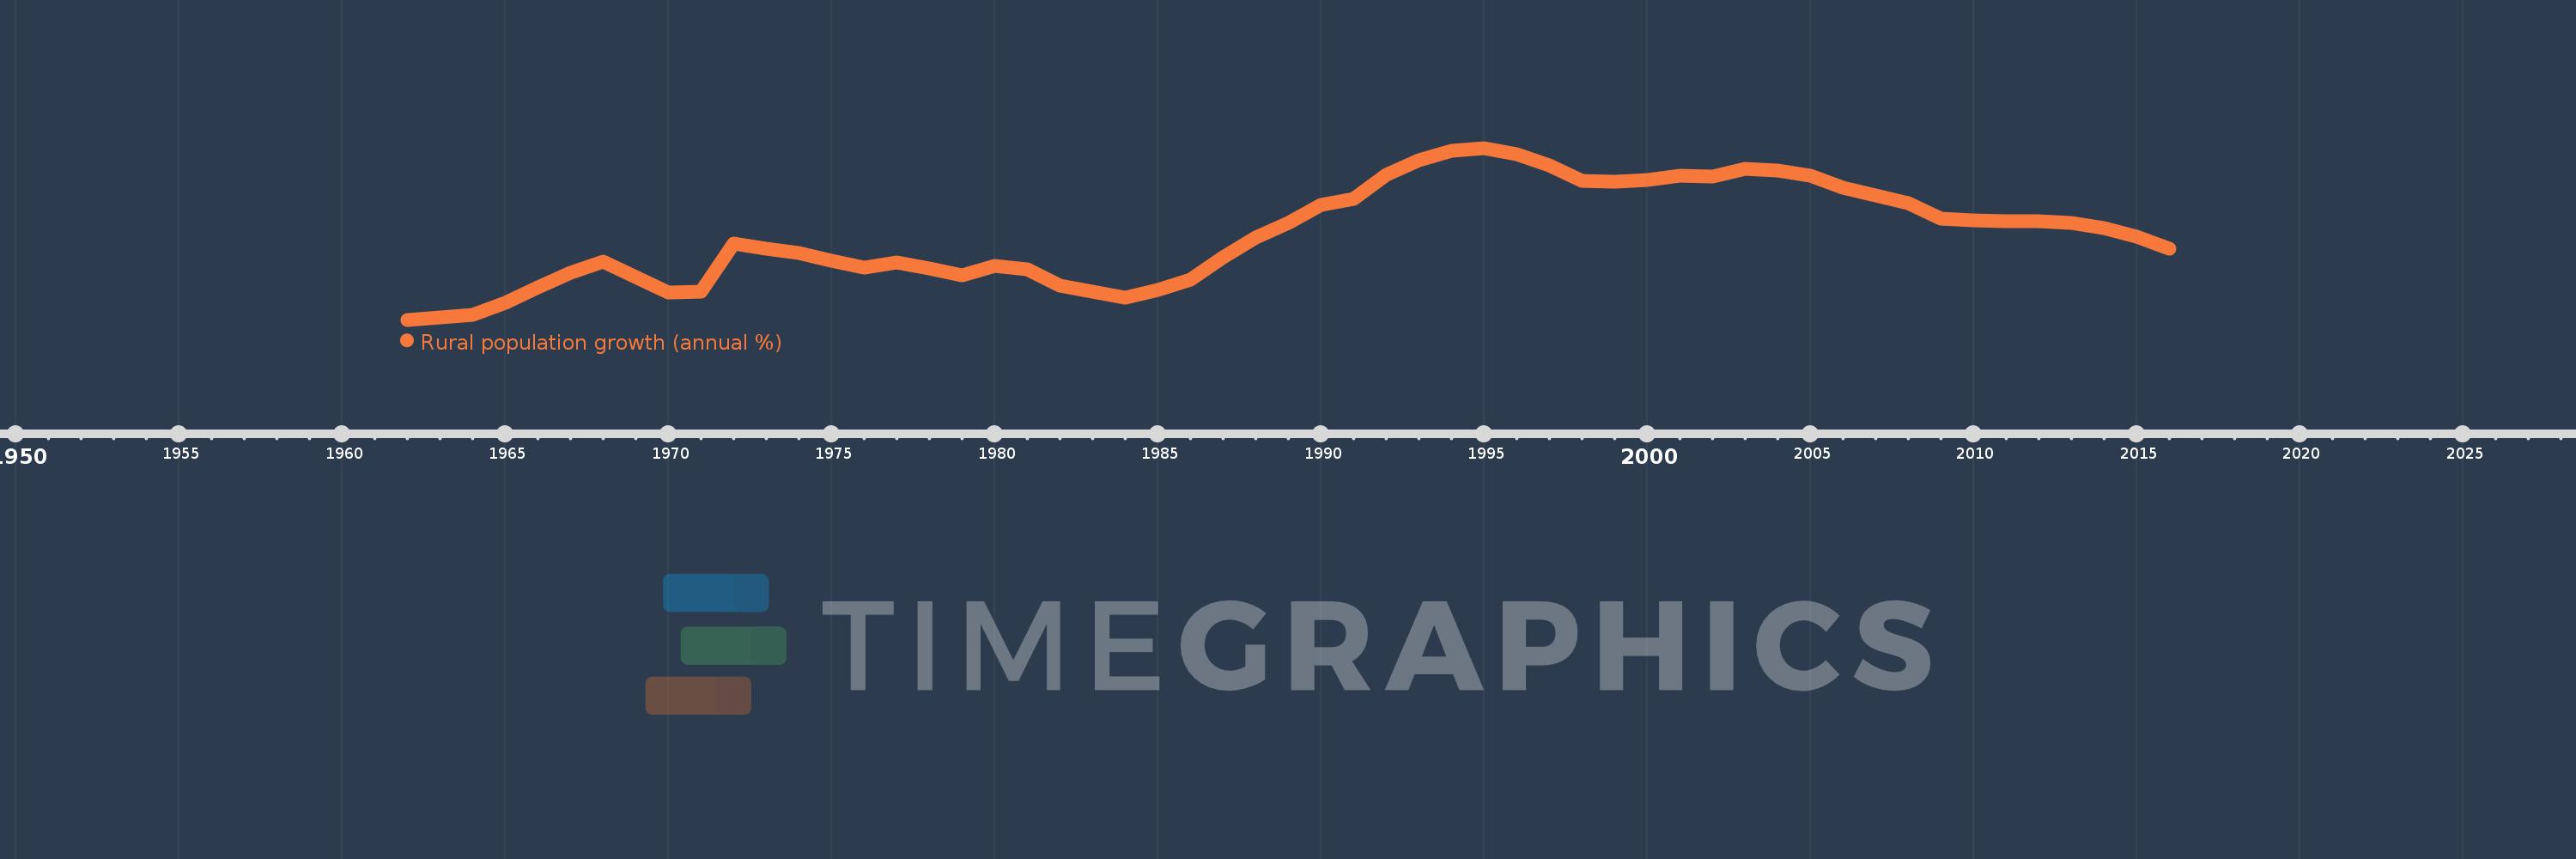
Rural population growth (annual %)
2016,2015,2014,2013,2012,2011,2010,2009,2008,2007,2006,2005,2004,2003,2002,2001,2000,1999,1998,1997,1996,1995,1994,1993,1992,1991,1990,1989,1988,1987,1986,1985,1984,1983,1982,1981,1980,1979,1978,1977,1976,1975,1974,1973,1972,1971,1970,1969,1968,1967,1966,1965,1964,1963,1962
This statistics in other country:
AfghanistanAlbaniaAlgeriaAmerican SamoaAndorraAngolaAntigua and BarbudaArab WorldArgentinaArmeniaArubaAustraliaAustriaAzerbaijanBahamas, TheBahrainBangladeshBarbadosBelarusBelgiumBelizeBeninBhutanBoliviaBosnia and HerzegovinaBotswanaBrazilBritish Virgin IslandsBrunei DarussalamBulgariaBurkina FasoBurundiCabo VerdeCambodiaCameroonCanadaCaribbean small statesCentral African RepublicCentral Europe and the BalticsChadChannel IslandsChileChinaColombiaComorosCongo, Dem. Rep.Congo, Rep.Costa RicaCote d'IvoireCroatiaCubaCuracaoCyprusCzech RepublicDenmarkDjiboutiDominicaDominican RepublicEarly-demographic dividendEast Asia & PacificEast Asia & Pacific (excluding high income)East Asia & Pacific (IDA & IBRD countries)EcuadorEgypt, Arab Rep.El SalvadorEquatorial GuineaEritreaEstoniaEthiopiaEuro areaEurope & Central AsiaEurope & Central Asia (excluding high income)Europe & Central Asia (IDA & IBRD countries)European UnionFaroe IslandsFijiFinlandFragile and conflict affected situationsFranceFrench PolynesiaGabonGambia, TheGeorgiaGermanyGhanaGreeceGreenlandGrenadaGuamGuatemalaGuineaGuinea-BissauGuyanaHaitiHeavily indebted poor countries (HIPC)High incomeHondurasHong Kong SAR, ChinaHungaryIBRD onlyIcelandIDA & IBRD totalIDA blendIDA onlyIDA totalIndiaIndonesiaIran, Islamic Rep.IraqIrelandIsle of ManIsraelItalyJamaicaJapanJordanKazakhstanKenyaKiribatiKorea, Dem. People’s Rep.Korea, Rep.KuwaitKyrgyz RepublicLao PDRLate-demographic dividendLatin America & Caribbean Latin America & Caribbean (excluding high income)Latin America & the Caribbean (IDA & IBRD countries)LatviaLeast developed countries: UN classificationLebanonLesothoLiberiaLibyaLiechtensteinLithuaniaLow & middle incomeLow incomeLower middle incomeLuxembourgMacao SAR, ChinaMacedonia, FYRMadagascarMalawiMalaysiaMaldivesMaliMaltaMarshall IslandsMauritaniaMauritiusMexicoMicronesia, Fed. Sts.Middle East & North AfricaMiddle East & North Africa (excluding high income)Middle East & North Africa (IDA & IBRD countries)Middle incomeMoldovaMongoliaMontenegroMoroccoMozambiqueMyanmarNamibiaNauruNepalNetherlandsNew CaledoniaNew ZealandNicaraguaNigerNigeriaNorth AmericaNorthern Mariana IslandsNorwayOECD membersOmanOther small statesPacific island small statesPakistanPalauPanamaPapua New GuineaParaguayPeruPhilippinesPolandPortugalPost-demographic dividendPre-demographic dividendPuerto RicoQatarRomaniaRussian FederationRwandaSamoaSan MarinoSao Tome and PrincipeSaudi ArabiaSenegalSerbiaSeychellesSierra LeoneSlovak RepublicSloveniaSmall statesSolomon IslandsSomaliaSouth AfricaSouth AsiaSouth Asia (IDA & IBRD)South SudanSpainSri LankaSt. Kitts and NevisSt. LuciaSt. Vincent and the GrenadinesSub-Saharan Africa Sub-Saharan Africa (excluding high income)Sub-Saharan Africa (IDA & IBRD countries)SudanSurinameSwazilandSwedenSwitzerlandSyrian Arab RepublicTajikistanTanzaniaThailandTimor-LesteTogoTongaTrinidad and TobagoTunisiaTurkeyTurkmenistanTurks and Caicos IslandsTuvaluUgandaUkraineUnited Arab EmiratesUnited KingdomUnited StatesUpper middle incomeUruguayUzbekistanVanuatuVenezuela, RBVietnamVirgin Islands (U.S.)West Bank and GazaWorldYemen, Rep.ZambiaZimbabwe Timeline:
This timeline shows a graph from 1962 to 2016 of Low income. No data until 1961. Number of actual observations by date: 55.
Source name:
World Development Indicators
Source organization:
World Bank Staff estimates based on United Nations, World Urbanization Prospects.
Categories, topics:
Agriculture & Rural Development
Last updated:
apr 23, 2017
Indicators value changes by year
At the date of observation
Value
Absolute change
Change from previous value
jan 1, 1962
1.846
+1.846
0.0%
jan 1, 1963
1.853
+0.007
0.36%
jan 1, 1964
1.865
+0.012
0.65%
jan 1, 1965
1.907
+0.043
2.29%
jan 1, 1966
1.964
+0.056
2.94%
jan 1, 1967
2.019
+0.055
2.83%
jan 1, 1968
2.059
+0.04
1.98%
jan 1, 1969
2.002
-0.057
-2.75%
jan 1, 1970
1.945
-0.057
-2.86%
jan 1, 1971
1.951
+0.006
0.32%
jan 1, 1972
2.128
+0.177
9.05%
jan 1, 1973
2.109
-0.019
-0.91%
jan 1, 1974
2.092
-0.016
-0.77%
jan 1, 1975
2.064
-0.028
-1.36%
jan 1, 1976
2.039
-0.025
-1.24%
jan 1, 1977
2.058
+0.019
0.94%
jan 1, 1978
2.036
-0.022
-1.07%
jan 1, 1979
2.011
-0.025
-1.22%
jan 1, 1980
2.043
+0.032
1.58%
jan 1, 1981
2.031
-0.011
-0.55%
jan 1, 1982
1.972
-0.059
-2.92%
jan 1, 1983
1.948
-0.024
-1.21%
jan 1, 1984
1.928
-0.02
-1.05%
jan 1, 1985
1.957
+0.029
1.51%
jan 1, 1986
1.994
+0.037
1.87%
jan 1, 1987
2.076
+0.082
4.14%
jan 1, 1988
2.149
+0.073
3.51%
jan 1, 1989
2.202
+0.053
2.48%
jan 1, 1990
2.268
+0.065
2.97%
jan 1, 1991
2.292
+0.024
1.08%
jan 1, 1992
2.379
+0.087
3.78%
jan 1, 1993
2.435
+0.056
2.36%
jan 1, 1994
2.47
+0.035
1.45%
jan 1, 1995
2.479
+0.009
0.37%
jan 1, 1996
2.457
-0.023
-0.92%
jan 1, 1997
2.415
-0.042
-1.7%
jan 1, 1998
2.357
-0.058
-2.39%
jan 1, 1999
2.355
-0.003
-0.11%
jan 1, 2000
2.361
+0.006
0.27%
jan 1, 2001
2.378
+0.017
0.74%
jan 1, 2002
2.373
-0.006
-0.24%
jan 1, 2003
2.402
+0.03
1.25%
jan 1, 2004
2.395
-0.007
-0.29%
jan 1, 2005
2.376
-0.02
-0.82%
jan 1, 2006
2.334
-0.042
-1.75%
jan 1, 2007
2.303
-0.031
-1.33%
jan 1, 2008
2.274
-0.029
-1.27%
jan 1, 2009
2.218
-0.056
-2.48%
jan 1, 2010
2.212
-0.005
-0.25%
jan 1, 2011
2.21
-0.002
-0.08%
jan 1, 2012
2.21
0.0
-0.01%
jan 1, 2013
2.202
-0.008
-0.38%
jan 1, 2014
2.184
-0.018
-0.82%
jan 1, 2015
2.151
-0.033
-1.51%
jan 1, 2016
2.108
-0.042
-1.97%
Ranking of countries by current statistics by years


Comments: