29
/
en
AIzaSyAYiBZKx7MnpbEhh9jyipgxe19OcubqV5w
April 1, 2024
199825
Mongolia
MNG
true
2
1
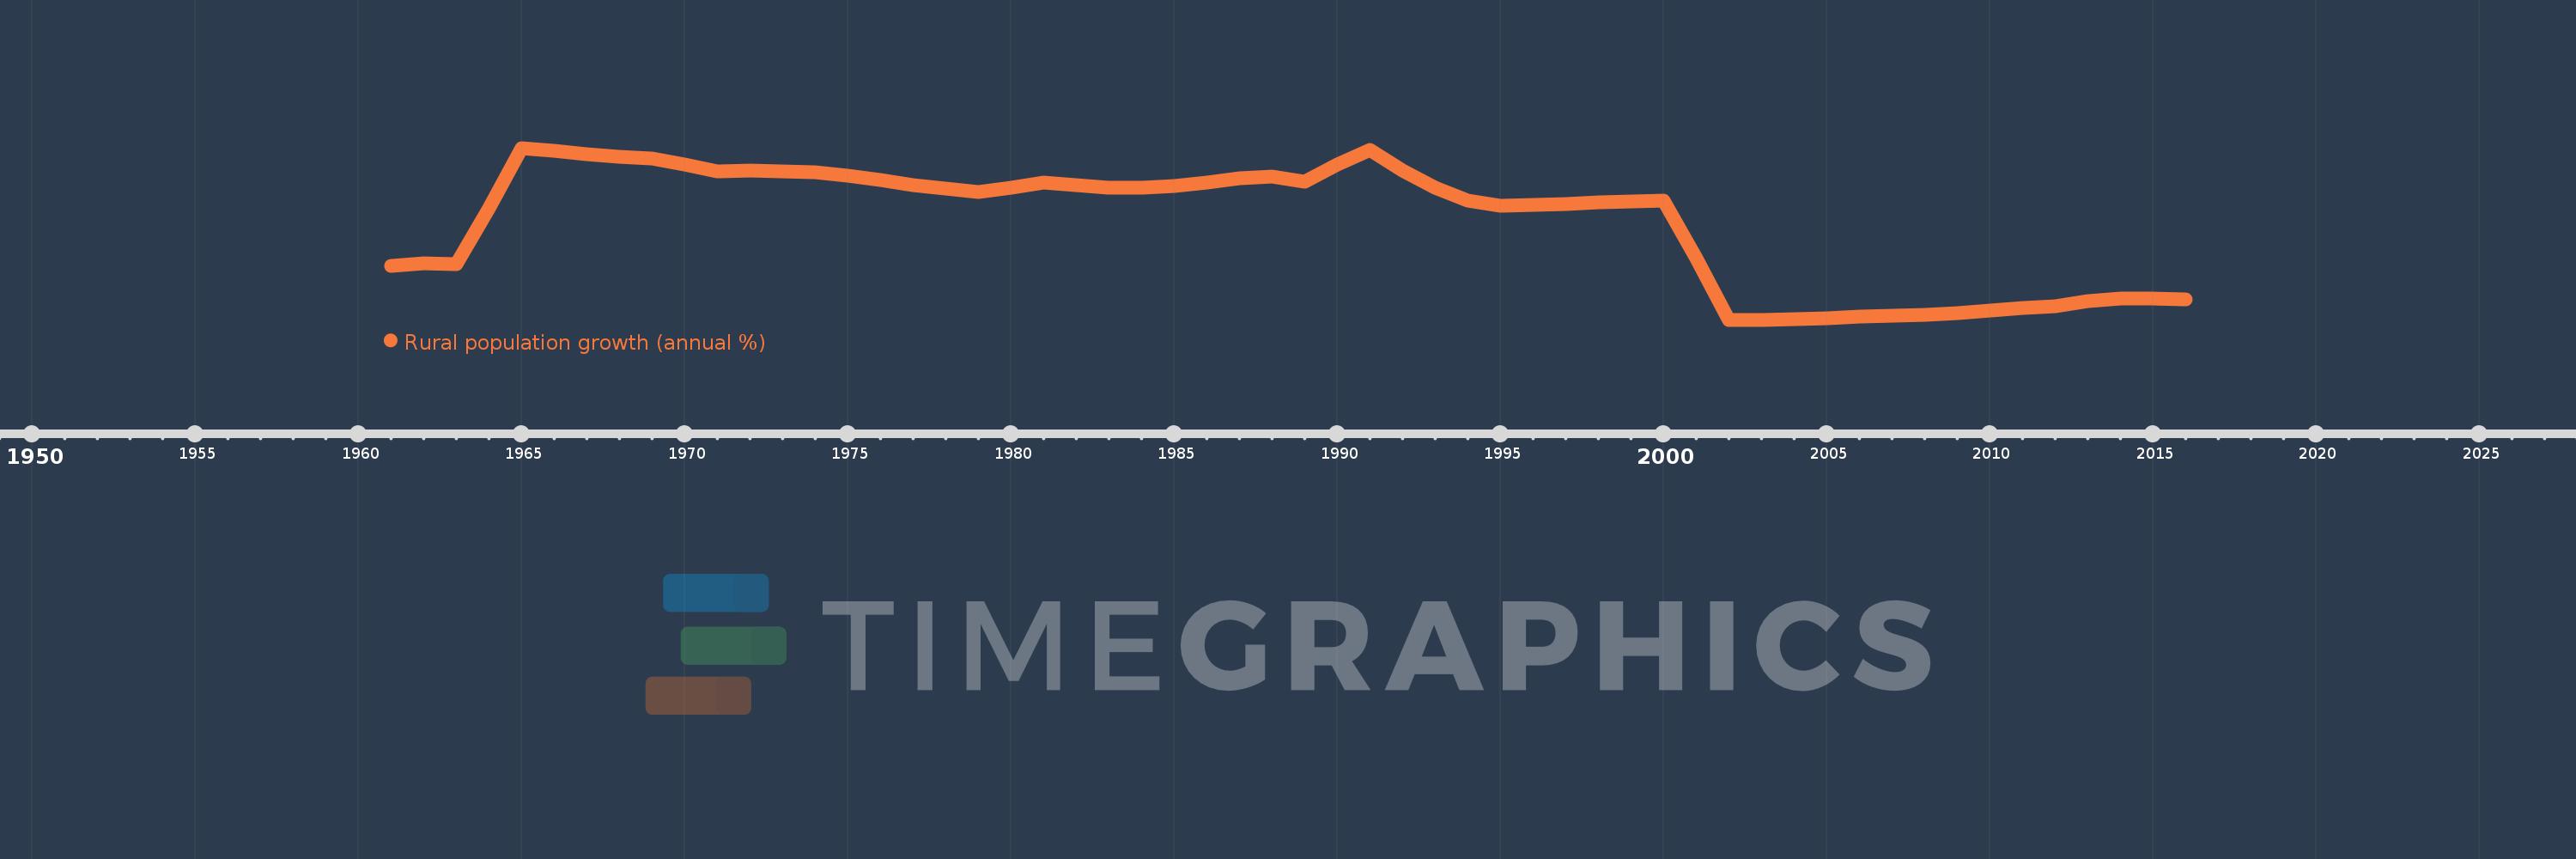
Rural population growth (annual %)
2016,2015,2014,2013,2012,2011,2010,2009,2008,2007,2006,2005,2004,2003,2002,2001,2000,1999,1998,1997,1996,1995,1994,1993,1992,1991,1990,1989,1988,1987,1986,1985,1984,1983,1982,1981,1980,1979,1978,1977,1976,1975,1974,1973,1972,1971,1970,1969,1968,1967,1966,1965,1964,1963,1962,1961
This statistics in other country:
AfghanistanAlbaniaAlgeriaAmerican SamoaAndorraAngolaAntigua and BarbudaArab WorldArgentinaArmeniaArubaAustraliaAustriaAzerbaijanBahamas, TheBahrainBangladeshBarbadosBelarusBelgiumBelizeBeninBhutanBoliviaBosnia and HerzegovinaBotswanaBrazilBritish Virgin IslandsBrunei DarussalamBulgariaBurkina FasoBurundiCabo VerdeCambodiaCameroonCanadaCaribbean small statesCentral African RepublicCentral Europe and the BalticsChadChannel IslandsChileChinaColombiaComorosCongo, Dem. Rep.Congo, Rep.Costa RicaCote d'IvoireCroatiaCubaCuracaoCyprusCzech RepublicDenmarkDjiboutiDominicaDominican RepublicEarly-demographic dividendEast Asia & PacificEast Asia & Pacific (excluding high income)East Asia & Pacific (IDA & IBRD countries)EcuadorEgypt, Arab Rep.El SalvadorEquatorial GuineaEritreaEstoniaEthiopiaEuro areaEurope & Central AsiaEurope & Central Asia (excluding high income)Europe & Central Asia (IDA & IBRD countries)European UnionFaroe IslandsFijiFinlandFragile and conflict affected situationsFranceFrench PolynesiaGabonGambia, TheGeorgiaGermanyGhanaGreeceGreenlandGrenadaGuamGuatemalaGuineaGuinea-BissauGuyanaHaitiHeavily indebted poor countries (HIPC)High incomeHondurasHong Kong SAR, ChinaHungaryIBRD onlyIcelandIDA & IBRD totalIDA blendIDA onlyIDA totalIndiaIndonesiaIran, Islamic Rep.IraqIrelandIsle of ManIsraelItalyJamaicaJapanJordanKazakhstanKenyaKiribatiKorea, Dem. People’s Rep.Korea, Rep.KuwaitKyrgyz RepublicLao PDRLate-demographic dividendLatin America & Caribbean Latin America & Caribbean (excluding high income)Latin America & the Caribbean (IDA & IBRD countries)LatviaLeast developed countries: UN classificationLebanonLesothoLiberiaLibyaLiechtensteinLithuaniaLow & middle incomeLow incomeLower middle incomeLuxembourgMacao SAR, ChinaMacedonia, FYRMadagascarMalawiMalaysiaMaldivesMaliMaltaMarshall IslandsMauritaniaMauritiusMexicoMicronesia, Fed. Sts.Middle East & North AfricaMiddle East & North Africa (excluding high income)Middle East & North Africa (IDA & IBRD countries)Middle incomeMoldovaMongoliaMontenegroMoroccoMozambiqueMyanmarNamibiaNauruNepalNetherlandsNew CaledoniaNew ZealandNicaraguaNigerNigeriaNorth AmericaNorthern Mariana IslandsNorwayOECD membersOmanOther small statesPacific island small statesPakistanPalauPanamaPapua New GuineaParaguayPeruPhilippinesPolandPortugalPost-demographic dividendPre-demographic dividendPuerto RicoQatarRomaniaRussian FederationRwandaSamoaSan MarinoSao Tome and PrincipeSaudi ArabiaSenegalSerbiaSeychellesSierra LeoneSlovak RepublicSloveniaSmall statesSolomon IslandsSomaliaSouth AfricaSouth AsiaSouth Asia (IDA & IBRD)South SudanSpainSri LankaSt. Kitts and NevisSt. LuciaSt. Vincent and the GrenadinesSub-Saharan Africa Sub-Saharan Africa (excluding high income)Sub-Saharan Africa (IDA & IBRD countries)SudanSurinameSwazilandSwedenSwitzerlandSyrian Arab RepublicTajikistanTanzaniaThailandTimor-LesteTogoTongaTrinidad and TobagoTunisiaTurkeyTurkmenistanTurks and Caicos IslandsTuvaluUgandaUkraineUnited Arab EmiratesUnited KingdomUnited StatesUpper middle incomeUruguayUzbekistanVanuatuVenezuela, RBVietnamVirgin Islands (U.S.)West Bank and GazaWorldYemen, Rep.ZambiaZimbabwe Timeline:
This timeline shows a graph from 1961 to 2016 of Mongolia. No data until 1960. Number of actual observations by date: 56.
Source name:
World Development Indicators
Source organization:
World Bank Staff estimates based on United Nations, World Urbanization Prospects.
Categories, topics:
Agriculture & Rural Development
Last updated:
apr 23, 2017
Indicators value changes by year
Minimum:
-1.648
jan 1, 2002
At the date of observation
Value
Absolute change
Change from previous value
jan 1, 1961
-0.453
-0.453
0.0%
jan 1, 1962
-0.411
+0.042
-9.32%
jan 1, 1963
-0.417
-0.006
1.49%
jan 1, 1964
0.8
+1.217
-291.74%
jan 1, 1965
2.135
+1.335
166.88%
jan 1, 1966
2.08
-0.055
-2.57%
jan 1, 1967
1.998
-0.082
-3.95%
jan 1, 1968
1.938
-0.06
-3.0%
jan 1, 1969
1.903
-0.035
-1.81%
jan 1, 1970
1.761
-0.142
-7.46%
jan 1, 1971
1.61
-0.151
-8.55%
jan 1, 1972
1.63
+0.02
1.22%
jan 1, 1973
1.625
-0.005
-0.28%
jan 1, 1974
1.597
-0.029
-1.77%
jan 1, 1975
1.523
-0.073
-4.6%
jan 1, 1976
1.427
-0.096
-6.29%
jan 1, 1977
1.325
-0.102
-7.15%
jan 1, 1978
1.246
-0.08
-6.01%
jan 1, 1979
1.172
-0.073
-5.88%
jan 1, 1980
1.255
+0.082
7.03%
jan 1, 1981
1.364
+0.109
8.69%
jan 1, 1982
1.317
-0.047
-3.41%
jan 1, 1983
1.262
-0.056
-4.23%
jan 1, 1984
1.252
-0.01
-0.78%
jan 1, 1985
1.301
+0.049
3.9%
jan 1, 1986
1.379
+0.079
6.05%
jan 1, 1987
1.476
+0.097
7.03%
jan 1, 1988
1.513
+0.037
2.51%
jan 1, 1989
1.389
-0.124
-8.18%
jan 1, 1990
1.779
+0.39
28.05%
jan 1, 1991
2.1
+0.32
18.01%
jan 1, 1992
1.642
-0.458
-21.82%
jan 1, 1993
1.252
-0.39
-23.75%
jan 1, 1994
0.981
-0.271
-21.63%
jan 1, 1995
0.866
-0.115
-11.76%
jan 1, 1996
0.873
+0.007
0.85%
jan 1, 1997
0.907
+0.034
3.94%
jan 1, 1998
0.929
+0.021
2.34%
jan 1, 1999
0.952
+0.024
2.53%
jan 1, 2000
0.976
+0.024
2.5%
jan 1, 2001
-0.291
-1.267
-129.86%
jan 1, 2002
-1.648
-1.356
465.5%
jan 1, 2003
-1.646
+0.002
-0.09%
jan 1, 2004
-1.635
+0.012
-0.7%
jan 1, 2005
-1.614
+0.021
-1.26%
jan 1, 2006
-1.576
+0.038
-2.35%
jan 1, 2007
-1.555
+0.021
-1.36%
jan 1, 2008
-1.531
+0.024
-1.52%
jan 1, 2009
-1.499
+0.032
-2.08%
jan 1, 2010
-1.439
+0.06
-3.99%
jan 1, 2011
-1.397
+0.043
-2.96%
jan 1, 2012
-1.343
+0.054
-3.86%
jan 1, 2013
-1.244
+0.099
-7.38%
jan 1, 2014
-1.178
+0.066
-5.27%
jan 1, 2015
-1.174
+0.005
-0.4%
jan 1, 2016
-1.205
-0.031
2.67%
Ranking of countries by current statistics by years


Comments: