29
/
en
AIzaSyAYiBZKx7MnpbEhh9jyipgxe19OcubqV5w
April 1, 2024
175826
Latvia
LVA
true
2
1
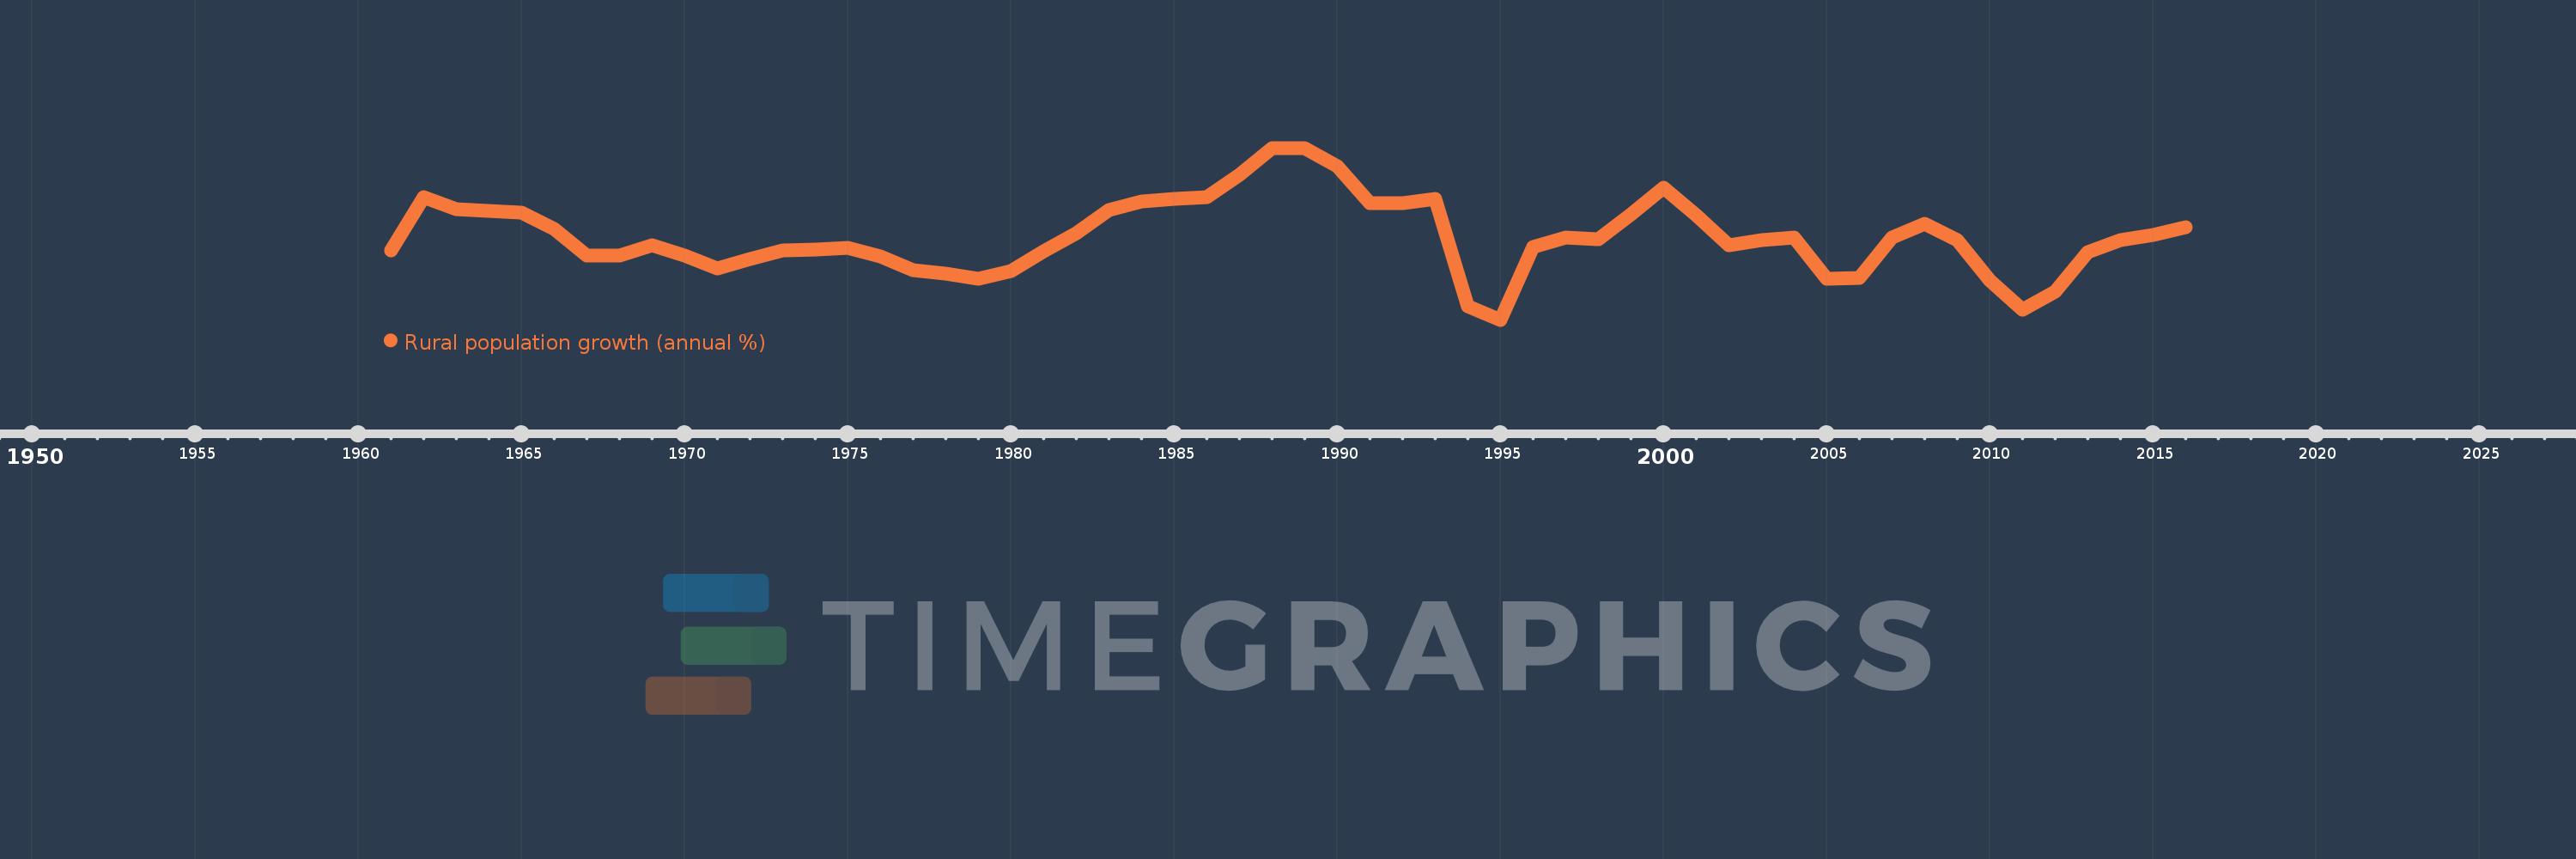
Rural population growth (annual %)
2016,2015,2014,2013,2012,2011,2010,2009,2008,2007,2006,2005,2004,2003,2002,2001,2000,1999,1998,1997,1996,1995,1994,1993,1992,1991,1990,1989,1988,1987,1986,1985,1984,1983,1982,1981,1980,1979,1978,1977,1976,1975,1974,1973,1972,1971,1970,1969,1968,1967,1966,1965,1964,1963,1962,1961
This statistics in other country:
AfghanistanAlbaniaAlgeriaAmerican SamoaAndorraAngolaAntigua and BarbudaArab WorldArgentinaArmeniaArubaAustraliaAustriaAzerbaijanBahamas, TheBahrainBangladeshBarbadosBelarusBelgiumBelizeBeninBhutanBoliviaBosnia and HerzegovinaBotswanaBrazilBritish Virgin IslandsBrunei DarussalamBulgariaBurkina FasoBurundiCabo VerdeCambodiaCameroonCanadaCaribbean small statesCentral African RepublicCentral Europe and the BalticsChadChannel IslandsChileChinaColombiaComorosCongo, Dem. Rep.Congo, Rep.Costa RicaCote d'IvoireCroatiaCubaCuracaoCyprusCzech RepublicDenmarkDjiboutiDominicaDominican RepublicEarly-demographic dividendEast Asia & PacificEast Asia & Pacific (excluding high income)East Asia & Pacific (IDA & IBRD countries)EcuadorEgypt, Arab Rep.El SalvadorEquatorial GuineaEritreaEstoniaEthiopiaEuro areaEurope & Central AsiaEurope & Central Asia (excluding high income)Europe & Central Asia (IDA & IBRD countries)European UnionFaroe IslandsFijiFinlandFragile and conflict affected situationsFranceFrench PolynesiaGabonGambia, TheGeorgiaGermanyGhanaGreeceGreenlandGrenadaGuamGuatemalaGuineaGuinea-BissauGuyanaHaitiHeavily indebted poor countries (HIPC)High incomeHondurasHong Kong SAR, ChinaHungaryIBRD onlyIcelandIDA & IBRD totalIDA blendIDA onlyIDA totalIndiaIndonesiaIran, Islamic Rep.IraqIrelandIsle of ManIsraelItalyJamaicaJapanJordanKazakhstanKenyaKiribatiKorea, Dem. People’s Rep.Korea, Rep.KuwaitKyrgyz RepublicLao PDRLate-demographic dividendLatin America & Caribbean Latin America & Caribbean (excluding high income)Latin America & the Caribbean (IDA & IBRD countries)LatviaLeast developed countries: UN classificationLebanonLesothoLiberiaLibyaLiechtensteinLithuaniaLow & middle incomeLow incomeLower middle incomeLuxembourgMacao SAR, ChinaMacedonia, FYRMadagascarMalawiMalaysiaMaldivesMaliMaltaMarshall IslandsMauritaniaMauritiusMexicoMicronesia, Fed. Sts.Middle East & North AfricaMiddle East & North Africa (excluding high income)Middle East & North Africa (IDA & IBRD countries)Middle incomeMoldovaMongoliaMontenegroMoroccoMozambiqueMyanmarNamibiaNauruNepalNetherlandsNew CaledoniaNew ZealandNicaraguaNigerNigeriaNorth AmericaNorthern Mariana IslandsNorwayOECD membersOmanOther small statesPacific island small statesPakistanPalauPanamaPapua New GuineaParaguayPeruPhilippinesPolandPortugalPost-demographic dividendPre-demographic dividendPuerto RicoQatarRomaniaRussian FederationRwandaSamoaSan MarinoSao Tome and PrincipeSaudi ArabiaSenegalSerbiaSeychellesSierra LeoneSlovak RepublicSloveniaSmall statesSolomon IslandsSomaliaSouth AfricaSouth AsiaSouth Asia (IDA & IBRD)South SudanSpainSri LankaSt. Kitts and NevisSt. LuciaSt. Vincent and the GrenadinesSub-Saharan Africa Sub-Saharan Africa (excluding high income)Sub-Saharan Africa (IDA & IBRD countries)SudanSurinameSwazilandSwedenSwitzerlandSyrian Arab RepublicTajikistanTanzaniaThailandTimor-LesteTogoTongaTrinidad and TobagoTunisiaTurkeyTurkmenistanTurks and Caicos IslandsTuvaluUgandaUkraineUnited Arab EmiratesUnited KingdomUnited StatesUpper middle incomeUruguayUzbekistanVanuatuVenezuela, RBVietnamVirgin Islands (U.S.)West Bank and GazaWorldYemen, Rep.ZambiaZimbabwe Timeline:
This timeline shows a graph from 1961 to 2016 of Latvia. No data until 1960. Number of actual observations by date: 56.
Source name:
World Development Indicators
Source organization:
World Bank Staff estimates based on United Nations, World Urbanization Prospects.
Categories, topics:
Agriculture & Rural Development
Last updated:
apr 23, 2017
Indicators value changes by year
Minimum:
-2.001
jan 1, 1995
At the date of observation
Value
Absolute change
Change from previous value
jan 1, 1961
-0.995
-0.995
0.0%
jan 1, 1962
-0.22
+0.775
-77.93%
jan 1, 1963
-0.399
-0.179
81.68%
jan 1, 1964
-0.423
-0.024
6.07%
jan 1, 1965
-0.451
-0.028
6.61%
jan 1, 1966
-0.684
-0.233
51.6%
jan 1, 1967
-1.075
-0.391
57.11%
jan 1, 1968
-1.074
+0.0
-0.02%
jan 1, 1969
-0.917
+0.158
-14.67%
jan 1, 1970
-1.068
-0.152
16.55%
jan 1, 1971
-1.253
-0.185
17.3%
jan 1, 1972
-1.122
+0.131
-10.47%
jan 1, 1973
-0.994
+0.128
-11.38%
jan 1, 1974
-0.982
+0.012
-1.23%
jan 1, 1975
-0.962
+0.02
-2.07%
jan 1, 1976
-1.086
-0.124
12.9%
jan 1, 1977
-1.281
-0.195
17.96%
jan 1, 1978
-1.329
-0.048
3.74%
jan 1, 1979
-1.403
-0.075
5.61%
jan 1, 1980
-1.296
+0.108
-7.66%
jan 1, 1981
-1.006
+0.29
-22.35%
jan 1, 1982
-0.747
+0.259
-25.75%
jan 1, 1983
-0.408
+0.339
-45.38%
jan 1, 1984
-0.286
+0.122
-29.87%
jan 1, 1985
-0.251
+0.035
-12.27%
jan 1, 1986
-0.222
+0.029
-11.39%
jan 1, 1987
0.103
+0.326
-146.32%
jan 1, 1988
0.491
+0.388
376.93%
jan 1, 1989
0.484
-0.007
-1.46%
jan 1, 1990
0.223
-0.261
-53.98%
jan 1, 1991
-0.305
-0.528
-236.91%
jan 1, 1992
-0.314
-0.009
2.87%
jan 1, 1993
-0.25
+0.064
-20.38%
jan 1, 1994
-1.802
-1.552
620.89%
jan 1, 1995
-2.001
-0.199
11.06%
jan 1, 1996
-0.941
+1.06
-52.95%
jan 1, 1997
-0.807
+0.135
-14.3%
jan 1, 1998
-0.837
-0.031
3.78%
jan 1, 1999
-0.469
+0.368
-43.94%
jan 1, 2000
-0.084
+0.385
-82.01%
jan 1, 2001
-0.484
-0.399
472.5%
jan 1, 2002
-0.926
-0.442
91.44%
jan 1, 2003
-0.85
+0.076
-8.16%
jan 1, 2004
-0.811
+0.039
-4.62%
jan 1, 2005
-1.402
-0.591
72.93%
jan 1, 2006
-1.393
+0.01
-0.71%
jan 1, 2007
-0.814
+0.578
-41.52%
jan 1, 2008
-0.607
+0.207
-25.43%
jan 1, 2009
-0.846
-0.238
39.25%
jan 1, 2010
-1.434
-0.588
69.55%
jan 1, 2011
-1.858
-0.425
29.61%
jan 1, 2012
-1.598
+0.26
-13.99%
jan 1, 2013
-1.018
+0.58
-36.28%
jan 1, 2014
-0.849
+0.169
-16.58%
jan 1, 2015
-0.773
+0.077
-9.03%
jan 1, 2016
-0.653
+0.12
-15.53%
Ranking of countries by current statistics by years


Comments: