29
/
en
AIzaSyAYiBZKx7MnpbEhh9jyipgxe19OcubqV5w
April 1, 2024
149737
Haiti
HTI
true
2
1
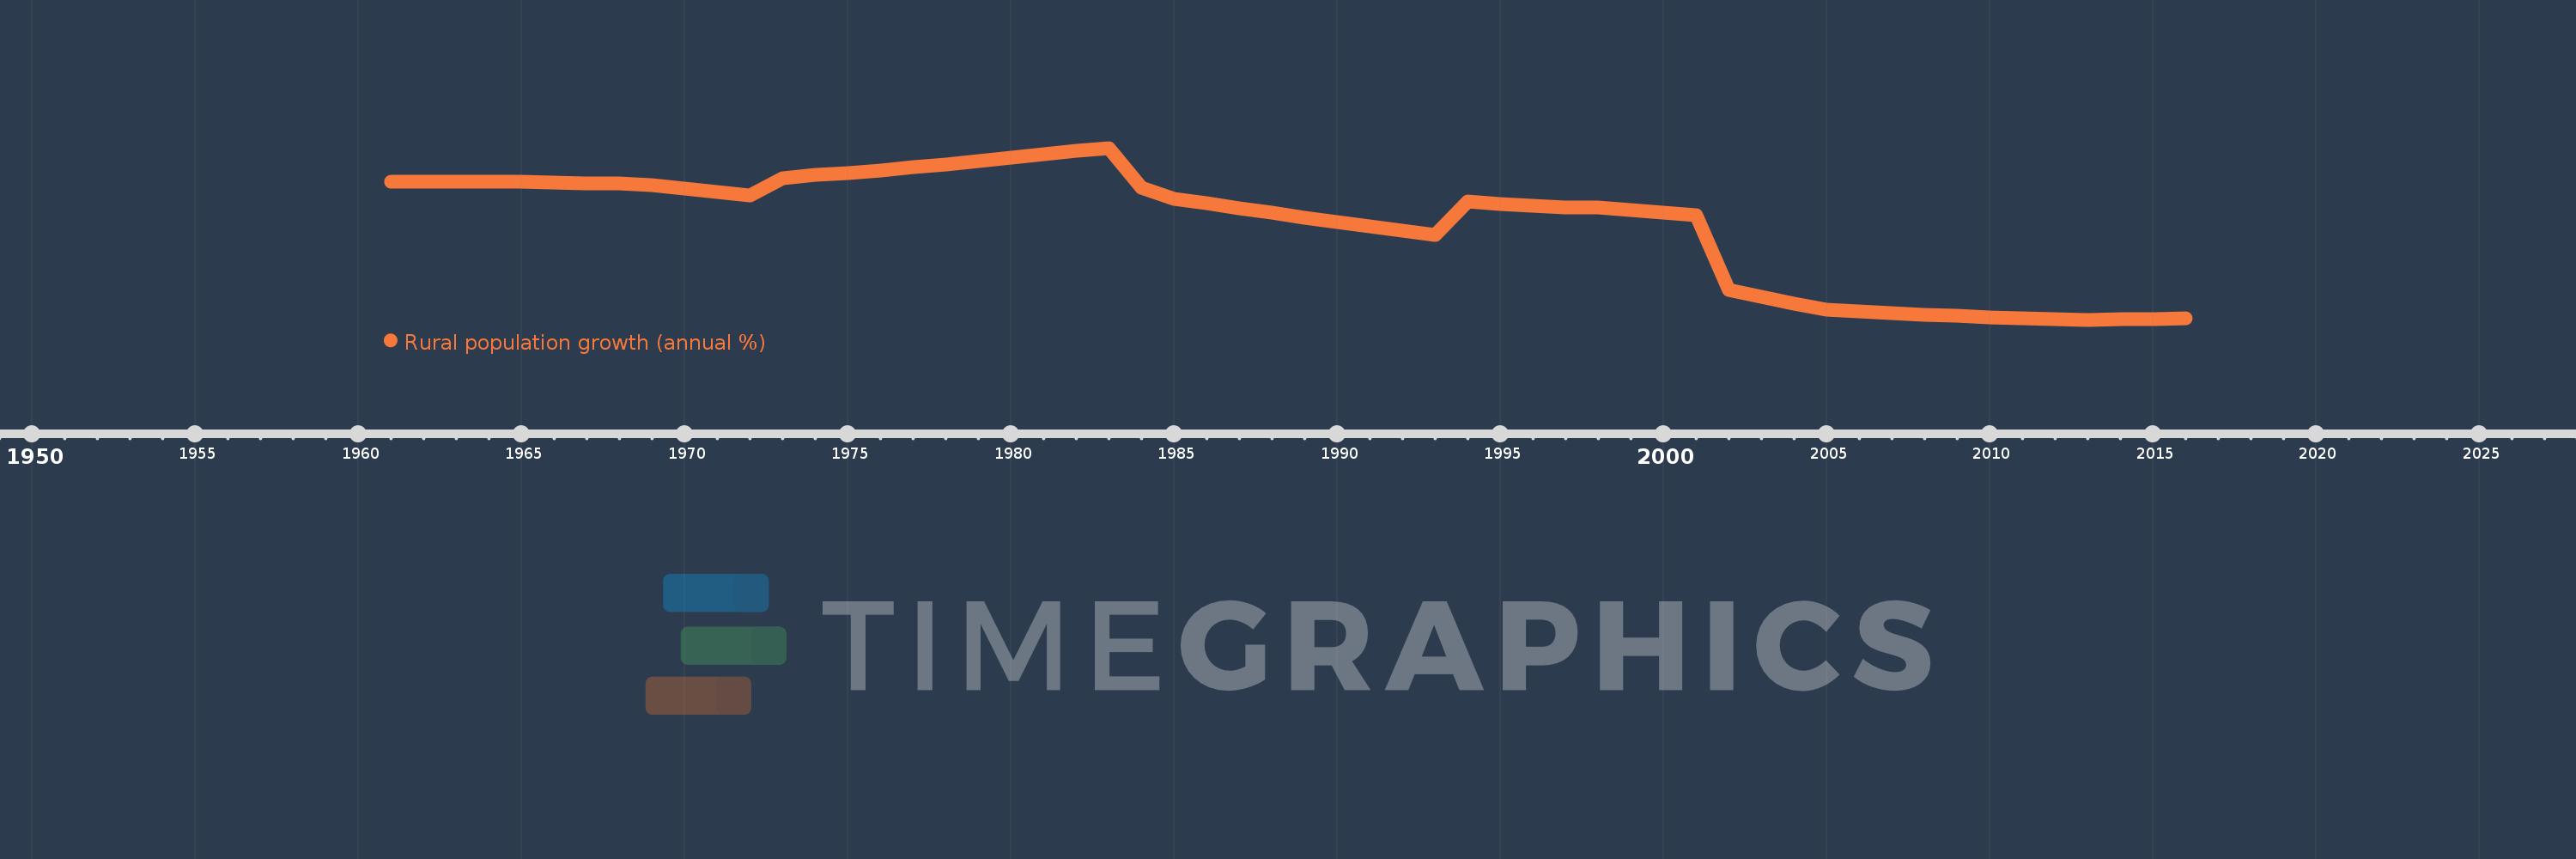
Rural population growth (annual %)
2016,2015,2014,2013,2012,2011,2010,2009,2008,2007,2006,2005,2004,2003,2002,2001,2000,1999,1998,1997,1996,1995,1994,1993,1992,1991,1990,1989,1988,1987,1986,1985,1984,1983,1982,1981,1980,1979,1978,1977,1976,1975,1974,1973,1972,1971,1970,1969,1968,1967,1966,1965,1964,1963,1962,1961
This statistics in other country:
AfghanistanAlbaniaAlgeriaAmerican SamoaAndorraAngolaAntigua and BarbudaArab WorldArgentinaArmeniaArubaAustraliaAustriaAzerbaijanBahamas, TheBahrainBangladeshBarbadosBelarusBelgiumBelizeBeninBhutanBoliviaBosnia and HerzegovinaBotswanaBrazilBritish Virgin IslandsBrunei DarussalamBulgariaBurkina FasoBurundiCabo VerdeCambodiaCameroonCanadaCaribbean small statesCentral African RepublicCentral Europe and the BalticsChadChannel IslandsChileChinaColombiaComorosCongo, Dem. Rep.Congo, Rep.Costa RicaCote d'IvoireCroatiaCubaCuracaoCyprusCzech RepublicDenmarkDjiboutiDominicaDominican RepublicEarly-demographic dividendEast Asia & PacificEast Asia & Pacific (excluding high income)East Asia & Pacific (IDA & IBRD countries)EcuadorEgypt, Arab Rep.El SalvadorEquatorial GuineaEritreaEstoniaEthiopiaEuro areaEurope & Central AsiaEurope & Central Asia (excluding high income)Europe & Central Asia (IDA & IBRD countries)European UnionFaroe IslandsFijiFinlandFragile and conflict affected situationsFranceFrench PolynesiaGabonGambia, TheGeorgiaGermanyGhanaGreeceGreenlandGrenadaGuamGuatemalaGuineaGuinea-BissauGuyanaHaitiHeavily indebted poor countries (HIPC)High incomeHondurasHong Kong SAR, ChinaHungaryIBRD onlyIcelandIDA & IBRD totalIDA blendIDA onlyIDA totalIndiaIndonesiaIran, Islamic Rep.IraqIrelandIsle of ManIsraelItalyJamaicaJapanJordanKazakhstanKenyaKiribatiKorea, Dem. People’s Rep.Korea, Rep.KuwaitKyrgyz RepublicLao PDRLate-demographic dividendLatin America & Caribbean Latin America & Caribbean (excluding high income)Latin America & the Caribbean (IDA & IBRD countries)LatviaLeast developed countries: UN classificationLebanonLesothoLiberiaLibyaLiechtensteinLithuaniaLow & middle incomeLow incomeLower middle incomeLuxembourgMacao SAR, ChinaMacedonia, FYRMadagascarMalawiMalaysiaMaldivesMaliMaltaMarshall IslandsMauritaniaMauritiusMexicoMicronesia, Fed. Sts.Middle East & North AfricaMiddle East & North Africa (excluding high income)Middle East & North Africa (IDA & IBRD countries)Middle incomeMoldovaMongoliaMontenegroMoroccoMozambiqueMyanmarNamibiaNauruNepalNetherlandsNew CaledoniaNew ZealandNicaraguaNigerNigeriaNorth AmericaNorthern Mariana IslandsNorwayOECD membersOmanOther small statesPacific island small statesPakistanPalauPanamaPapua New GuineaParaguayPeruPhilippinesPolandPortugalPost-demographic dividendPre-demographic dividendPuerto RicoQatarRomaniaRussian FederationRwandaSamoaSan MarinoSao Tome and PrincipeSaudi ArabiaSenegalSerbiaSeychellesSierra LeoneSlovak RepublicSloveniaSmall statesSolomon IslandsSomaliaSouth AfricaSouth AsiaSouth Asia (IDA & IBRD)South SudanSpainSri LankaSt. Kitts and NevisSt. LuciaSt. Vincent and the GrenadinesSub-Saharan Africa Sub-Saharan Africa (excluding high income)Sub-Saharan Africa (IDA & IBRD countries)SudanSurinameSwazilandSwedenSwitzerlandSyrian Arab RepublicTajikistanTanzaniaThailandTimor-LesteTogoTongaTrinidad and TobagoTunisiaTurkeyTurkmenistanTurks and Caicos IslandsTuvaluUgandaUkraineUnited Arab EmiratesUnited KingdomUnited StatesUpper middle incomeUruguayUzbekistanVanuatuVenezuela, RBVietnamVirgin Islands (U.S.)West Bank and GazaWorldYemen, Rep.ZambiaZimbabwe Timeline:
This timeline shows a graph from 1961 to 2016 of Haiti. No data until 1960. Number of actual observations by date: 56.
Source name:
World Development Indicators
Source organization:
World Bank Staff estimates based on United Nations, World Urbanization Prospects.
Categories, topics:
Agriculture & Rural Development
Last updated:
apr 23, 2017
Indicators value changes by year
Minimum:
-1.612
jan 1, 2013
At the date of observation
Value
Absolute change
Change from previous value
jan 1, 1961
1.516
+1.516
0.0%
jan 1, 1962
1.524
+0.007
0.49%
jan 1, 1963
1.524
+0.0
0.03%
jan 1, 1964
1.521
-0.003
-0.2%
jan 1, 1965
1.511
-0.01
-0.66%
jan 1, 1966
1.5
-0.012
-0.77%
jan 1, 1967
1.489
-0.01
-0.67%
jan 1, 1968
1.477
-0.012
-0.82%
jan 1, 1969
1.439
-0.039
-2.62%
jan 1, 1970
1.373
-0.066
-4.56%
jan 1, 1971
1.291
-0.082
-5.97%
jan 1, 1972
1.204
-0.087
-6.72%
jan 1, 1973
1.598
+0.394
32.74%
jan 1, 1974
1.676
+0.078
4.85%
jan 1, 1975
1.711
+0.035
2.06%
jan 1, 1976
1.78
+0.07
4.07%
jan 1, 1977
1.852
+0.072
4.06%
jan 1, 1978
1.915
+0.063
3.4%
jan 1, 1979
1.989
+0.073
3.83%
jan 1, 1980
2.067
+0.078
3.93%
jan 1, 1981
2.143
+0.076
3.68%
jan 1, 1982
2.223
+0.08
3.73%
jan 1, 1983
2.286
+0.064
2.86%
jan 1, 1984
1.379
-0.907
-39.69%
jan 1, 1985
1.13
-0.249
-18.05%
jan 1, 1986
1.031
-0.099
-8.78%
jan 1, 1987
0.917
-0.114
-11.07%
jan 1, 1988
0.809
-0.108
-11.76%
jan 1, 1989
0.7
-0.109
-13.47%
jan 1, 1990
0.605
-0.095
-13.54%
jan 1, 1991
0.507
-0.098
-16.21%
jan 1, 1992
0.409
-0.099
-19.43%
jan 1, 1993
0.302
-0.107
-26.1%
jan 1, 1994
1.071
+0.769
254.68%
jan 1, 1995
1.023
-0.048
-4.47%
jan 1, 1996
0.98
-0.043
-4.22%
jan 1, 1997
0.938
-0.042
-4.31%
jan 1, 1998
0.931
-0.006
-0.69%
jan 1, 1999
0.884
-0.047
-5.02%
jan 1, 2000
0.828
-0.056
-6.37%
jan 1, 2001
0.769
-0.059
-7.18%
jan 1, 2002
-0.934
-1.703
-221.53%
jan 1, 2003
-1.098
-0.164
17.55%
jan 1, 2004
-1.248
-0.15
13.64%
jan 1, 2005
-1.392
-0.144
11.56%
jan 1, 2006
-1.431
-0.039
2.8%
jan 1, 2007
-1.471
-0.04
2.82%
jan 1, 2008
-1.503
-0.032
2.19%
jan 1, 2009
-1.53
-0.027
1.79%
jan 1, 2010
-1.559
-0.029
1.89%
jan 1, 2011
-1.586
-0.027
1.74%
jan 1, 2012
-1.605
-0.018
1.14%
jan 1, 2013
-1.612
-0.007
0.46%
jan 1, 2014
-1.608
+0.004
-0.26%
jan 1, 2015
-1.595
+0.013
-0.8%
jan 1, 2016
-1.575
+0.02
-1.25%
Ranking of countries by current statistics by years


Comments: