29
/
en
AIzaSyAYiBZKx7MnpbEhh9jyipgxe19OcubqV5w
April 1, 2024
28677
East Asia & Pacific (excluding high income)
EAP
false
2
1
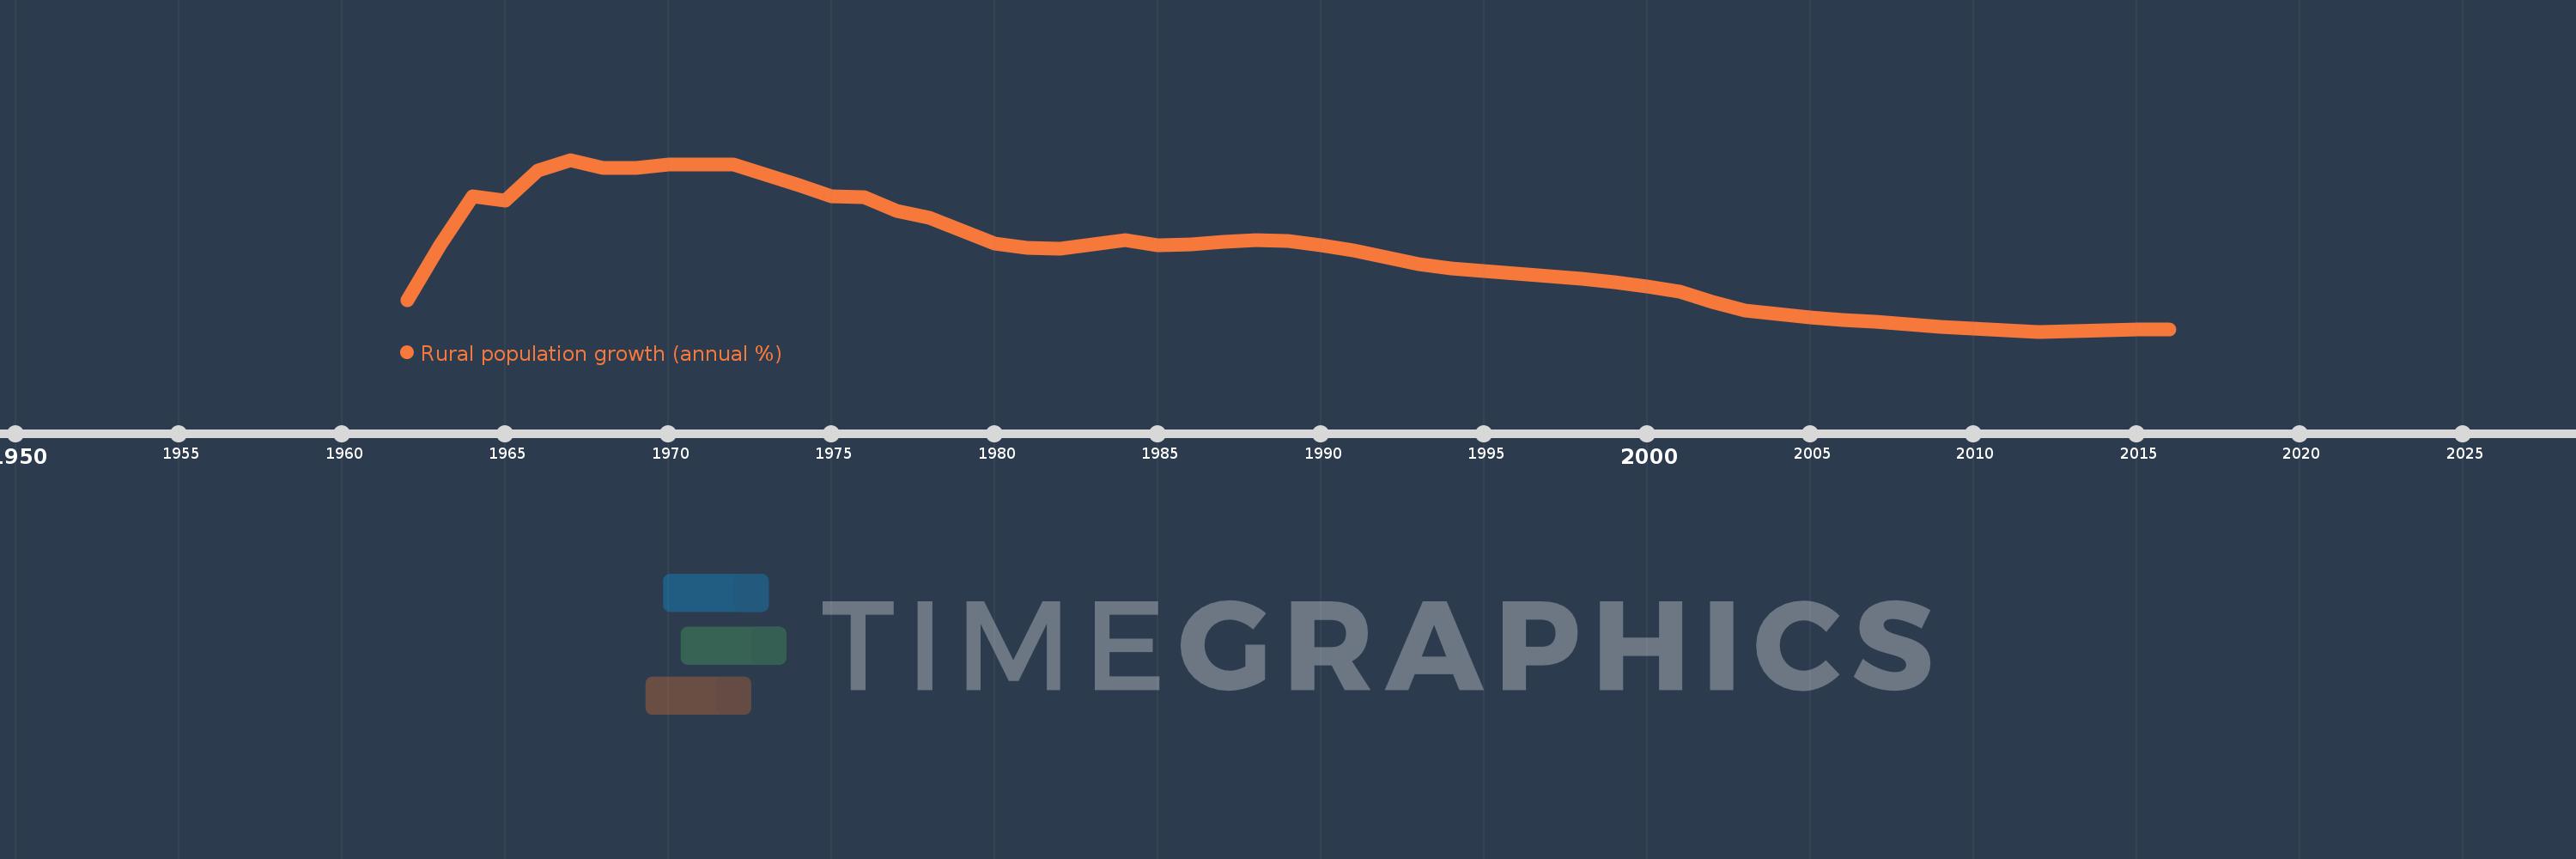
Rural population growth (annual %)
2016,2015,2014,2013,2012,2011,2010,2009,2008,2007,2006,2005,2004,2003,2002,2001,2000,1999,1998,1997,1996,1995,1994,1993,1992,1991,1990,1989,1988,1987,1986,1985,1984,1983,1982,1981,1980,1979,1978,1977,1976,1975,1974,1973,1972,1971,1970,1969,1968,1967,1966,1965,1964,1963,1962
This statistics in other country:
AfghanistanAlbaniaAlgeriaAmerican SamoaAndorraAngolaAntigua and BarbudaArab WorldArgentinaArmeniaArubaAustraliaAustriaAzerbaijanBahamas, TheBahrainBangladeshBarbadosBelarusBelgiumBelizeBeninBhutanBoliviaBosnia and HerzegovinaBotswanaBrazilBritish Virgin IslandsBrunei DarussalamBulgariaBurkina FasoBurundiCabo VerdeCambodiaCameroonCanadaCaribbean small statesCentral African RepublicCentral Europe and the BalticsChadChannel IslandsChileChinaColombiaComorosCongo, Dem. Rep.Congo, Rep.Costa RicaCote d'IvoireCroatiaCubaCuracaoCyprusCzech RepublicDenmarkDjiboutiDominicaDominican RepublicEarly-demographic dividendEast Asia & PacificEast Asia & Pacific (excluding high income)East Asia & Pacific (IDA & IBRD countries)EcuadorEgypt, Arab Rep.El SalvadorEquatorial GuineaEritreaEstoniaEthiopiaEuro areaEurope & Central AsiaEurope & Central Asia (excluding high income)Europe & Central Asia (IDA & IBRD countries)European UnionFaroe IslandsFijiFinlandFragile and conflict affected situationsFranceFrench PolynesiaGabonGambia, TheGeorgiaGermanyGhanaGreeceGreenlandGrenadaGuamGuatemalaGuineaGuinea-BissauGuyanaHaitiHeavily indebted poor countries (HIPC)High incomeHondurasHong Kong SAR, ChinaHungaryIBRD onlyIcelandIDA & IBRD totalIDA blendIDA onlyIDA totalIndiaIndonesiaIran, Islamic Rep.IraqIrelandIsle of ManIsraelItalyJamaicaJapanJordanKazakhstanKenyaKiribatiKorea, Dem. People’s Rep.Korea, Rep.KuwaitKyrgyz RepublicLao PDRLate-demographic dividendLatin America & Caribbean Latin America & Caribbean (excluding high income)Latin America & the Caribbean (IDA & IBRD countries)LatviaLeast developed countries: UN classificationLebanonLesothoLiberiaLibyaLiechtensteinLithuaniaLow & middle incomeLow incomeLower middle incomeLuxembourgMacao SAR, ChinaMacedonia, FYRMadagascarMalawiMalaysiaMaldivesMaliMaltaMarshall IslandsMauritaniaMauritiusMexicoMicronesia, Fed. Sts.Middle East & North AfricaMiddle East & North Africa (excluding high income)Middle East & North Africa (IDA & IBRD countries)Middle incomeMoldovaMongoliaMontenegroMoroccoMozambiqueMyanmarNamibiaNauruNepalNetherlandsNew CaledoniaNew ZealandNicaraguaNigerNigeriaNorth AmericaNorthern Mariana IslandsNorwayOECD membersOmanOther small statesPacific island small statesPakistanPalauPanamaPapua New GuineaParaguayPeruPhilippinesPolandPortugalPost-demographic dividendPre-demographic dividendPuerto RicoQatarRomaniaRussian FederationRwandaSamoaSan MarinoSao Tome and PrincipeSaudi ArabiaSenegalSerbiaSeychellesSierra LeoneSlovak RepublicSloveniaSmall statesSolomon IslandsSomaliaSouth AfricaSouth AsiaSouth Asia (IDA & IBRD)South SudanSpainSri LankaSt. Kitts and NevisSt. LuciaSt. Vincent and the GrenadinesSub-Saharan Africa Sub-Saharan Africa (excluding high income)Sub-Saharan Africa (IDA & IBRD countries)SudanSurinameSwazilandSwedenSwitzerlandSyrian Arab RepublicTajikistanTanzaniaThailandTimor-LesteTogoTongaTrinidad and TobagoTunisiaTurkeyTurkmenistanTurks and Caicos IslandsTuvaluUgandaUkraineUnited Arab EmiratesUnited KingdomUnited StatesUpper middle incomeUruguayUzbekistanVanuatuVenezuela, RBVietnamVirgin Islands (U.S.)West Bank and GazaWorldYemen, Rep.ZambiaZimbabwe Timeline:
This timeline shows a graph from 1962 to 2016 of East Asia & Pacific (excluding high income). No data until 1961. Number of actual observations by date: 55.
Source name:
World Development Indicators
Source organization:
World Bank Staff estimates based on United Nations, World Urbanization Prospects.
Categories, topics:
Agriculture & Rural Development
Last updated:
apr 23, 2017
Indicators value changes by year
At the date of observation
Value
Absolute change
Change from previous value
jan 1, 1962
-0.648
-0.648
0.0%
jan 1, 1963
0.718
+1.366
-210.71%
jan 1, 1964
1.933
+1.215
169.31%
jan 1, 1965
1.819
-0.113
-5.86%
jan 1, 1966
2.563
+0.743
40.85%
jan 1, 1967
2.833
+0.27
10.54%
jan 1, 1968
2.621
-0.212
-7.49%
jan 1, 1969
2.633
+0.013
0.49%
jan 1, 1970
2.718
+0.085
3.22%
jan 1, 1971
2.726
+0.008
0.29%
jan 1, 1972
2.71
-0.016
-0.6%
jan 1, 1973
2.462
-0.248
-9.14%
jan 1, 1974
2.212
-0.25
-10.16%
jan 1, 1975
1.933
-0.279
-12.61%
jan 1, 1976
1.899
-0.034
-1.77%
jan 1, 1977
1.569
-0.33
-17.37%
jan 1, 1978
1.405
-0.164
-10.44%
jan 1, 1979
1.077
-0.328
-23.32%
jan 1, 1980
0.76
-0.317
-29.45%
jan 1, 1981
0.657
-0.103
-13.58%
jan 1, 1982
0.63
-0.027
-4.04%
jan 1, 1983
0.748
+0.118
18.65%
jan 1, 1984
0.849
+0.101
13.47%
jan 1, 1985
0.722
-0.127
-14.93%
jan 1, 1986
0.732
+0.01
1.37%
jan 1, 1987
0.799
+0.067
9.15%
jan 1, 1988
0.851
+0.053
6.6%
jan 1, 1989
0.813
-0.038
-4.49%
jan 1, 1990
0.712
-0.101
-12.47%
jan 1, 1991
0.599
-0.113
-15.86%
jan 1, 1992
0.411
-0.188
-31.38%
jan 1, 1993
0.245
-0.166
-40.5%
jan 1, 1994
0.142
-0.102
-41.75%
jan 1, 1995
0.083
-0.059
-41.52%
jan 1, 1996
0.012
-0.071
-85.02%
jan 1, 1997
-0.059
-0.072
-574.16%
jan 1, 1998
-0.114
-0.055
92.83%
jan 1, 1999
-0.203
-0.089
77.99%
jan 1, 2000
-0.313
-0.11
53.95%
jan 1, 2001
-0.438
-0.125
40.11%
jan 1, 2002
-0.682
-0.244
55.76%
jan 1, 2003
-0.89
-0.207
30.38%
jan 1, 2004
-0.983
-0.093
10.5%
jan 1, 2005
-1.067
-0.084
8.53%
jan 1, 2006
-1.134
-0.067
6.29%
jan 1, 2007
-1.172
-0.038
3.35%
jan 1, 2008
-1.23
-0.058
4.94%
jan 1, 2009
-1.294
-0.064
5.18%
jan 1, 2010
-1.341
-0.048
3.7%
jan 1, 2011
-1.39
-0.049
3.63%
jan 1, 2012
-1.42
-0.029
2.11%
jan 1, 2013
-1.405
+0.014
-1.0%
jan 1, 2014
-1.387
+0.019
-1.32%
jan 1, 2015
-1.368
+0.019
-1.34%
jan 1, 2016
-1.359
+0.009
-0.66%
Ranking of countries by current statistics by years


Comments: