29
/
en
AIzaSyAYiBZKx7MnpbEhh9jyipgxe19OcubqV5w
April 1, 2024
248019
Spain
ESP
true
2
1
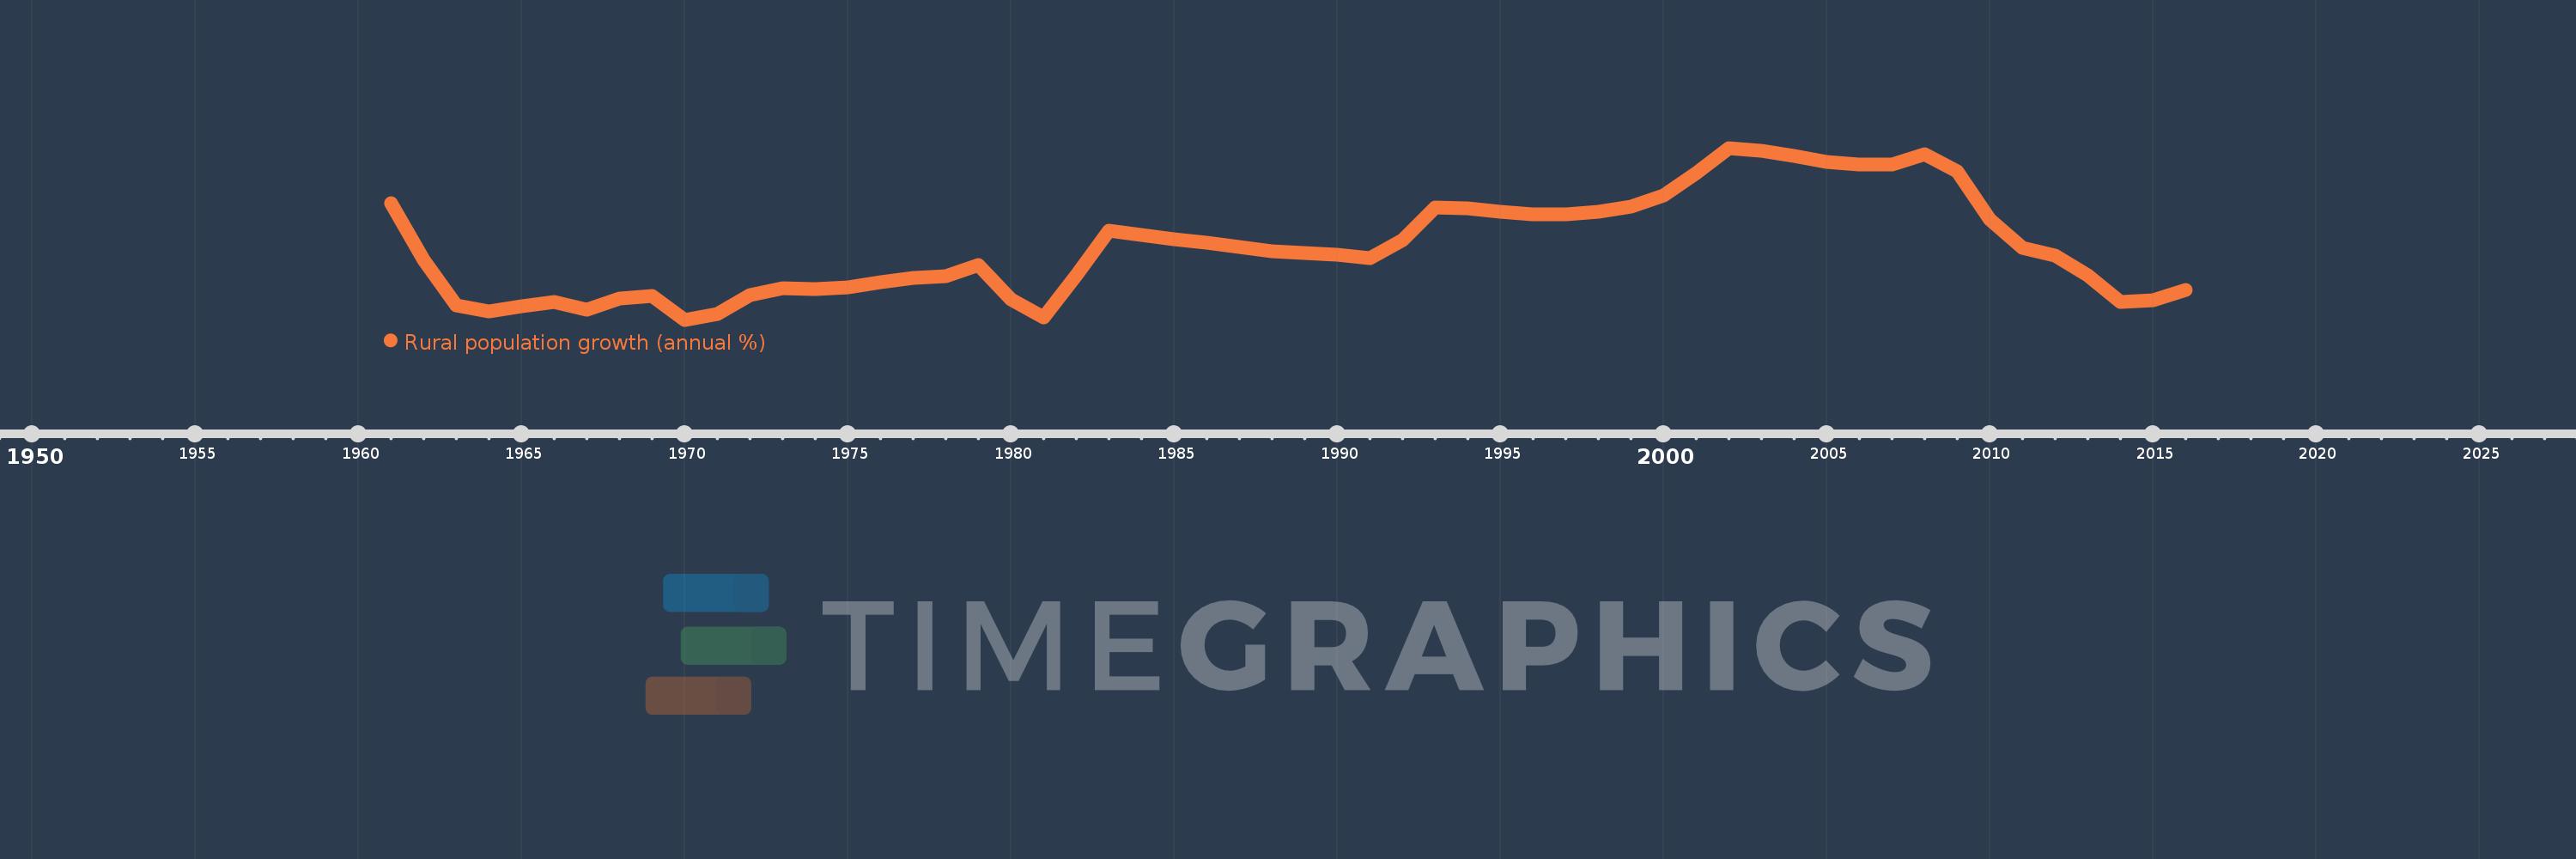
Rural population growth (annual %)
2016,2015,2014,2013,2012,2011,2010,2009,2008,2007,2006,2005,2004,2003,2002,2001,2000,1999,1998,1997,1996,1995,1994,1993,1992,1991,1990,1989,1988,1987,1986,1985,1984,1983,1982,1981,1980,1979,1978,1977,1976,1975,1974,1973,1972,1971,1970,1969,1968,1967,1966,1965,1964,1963,1962,1961
This statistics in other country:
AfghanistanAlbaniaAlgeriaAmerican SamoaAndorraAngolaAntigua and BarbudaArab WorldArgentinaArmeniaArubaAustraliaAustriaAzerbaijanBahamas, TheBahrainBangladeshBarbadosBelarusBelgiumBelizeBeninBhutanBoliviaBosnia and HerzegovinaBotswanaBrazilBritish Virgin IslandsBrunei DarussalamBulgariaBurkina FasoBurundiCabo VerdeCambodiaCameroonCanadaCaribbean small statesCentral African RepublicCentral Europe and the BalticsChadChannel IslandsChileChinaColombiaComorosCongo, Dem. Rep.Congo, Rep.Costa RicaCote d'IvoireCroatiaCubaCuracaoCyprusCzech RepublicDenmarkDjiboutiDominicaDominican RepublicEarly-demographic dividendEast Asia & PacificEast Asia & Pacific (excluding high income)East Asia & Pacific (IDA & IBRD countries)EcuadorEgypt, Arab Rep.El SalvadorEquatorial GuineaEritreaEstoniaEthiopiaEuro areaEurope & Central AsiaEurope & Central Asia (excluding high income)Europe & Central Asia (IDA & IBRD countries)European UnionFaroe IslandsFijiFinlandFragile and conflict affected situationsFranceFrench PolynesiaGabonGambia, TheGeorgiaGermanyGhanaGreeceGreenlandGrenadaGuamGuatemalaGuineaGuinea-BissauGuyanaHaitiHeavily indebted poor countries (HIPC)High incomeHondurasHong Kong SAR, ChinaHungaryIBRD onlyIcelandIDA & IBRD totalIDA blendIDA onlyIDA totalIndiaIndonesiaIran, Islamic Rep.IraqIrelandIsle of ManIsraelItalyJamaicaJapanJordanKazakhstanKenyaKiribatiKorea, Dem. People’s Rep.Korea, Rep.KuwaitKyrgyz RepublicLao PDRLate-demographic dividendLatin America & Caribbean Latin America & Caribbean (excluding high income)Latin America & the Caribbean (IDA & IBRD countries)LatviaLeast developed countries: UN classificationLebanonLesothoLiberiaLibyaLiechtensteinLithuaniaLow & middle incomeLow incomeLower middle incomeLuxembourgMacao SAR, ChinaMacedonia, FYRMadagascarMalawiMalaysiaMaldivesMaliMaltaMarshall IslandsMauritaniaMauritiusMexicoMicronesia, Fed. Sts.Middle East & North AfricaMiddle East & North Africa (excluding high income)Middle East & North Africa (IDA & IBRD countries)Middle incomeMoldovaMongoliaMontenegroMoroccoMozambiqueMyanmarNamibiaNauruNepalNetherlandsNew CaledoniaNew ZealandNicaraguaNigerNigeriaNorth AmericaNorthern Mariana IslandsNorwayOECD membersOmanOther small statesPacific island small statesPakistanPalauPanamaPapua New GuineaParaguayPeruPhilippinesPolandPortugalPost-demographic dividendPre-demographic dividendPuerto RicoQatarRomaniaRussian FederationRwandaSamoaSan MarinoSao Tome and PrincipeSaudi ArabiaSenegalSerbiaSeychellesSierra LeoneSlovak RepublicSloveniaSmall statesSolomon IslandsSomaliaSouth AfricaSouth AsiaSouth Asia (IDA & IBRD)South SudanSpainSri LankaSt. Kitts and NevisSt. LuciaSt. Vincent and the GrenadinesSub-Saharan Africa Sub-Saharan Africa (excluding high income)Sub-Saharan Africa (IDA & IBRD countries)SudanSurinameSwazilandSwedenSwitzerlandSyrian Arab RepublicTajikistanTanzaniaThailandTimor-LesteTogoTongaTrinidad and TobagoTunisiaTurkeyTurkmenistanTurks and Caicos IslandsTuvaluUgandaUkraineUnited Arab EmiratesUnited KingdomUnited StatesUpper middle incomeUruguayUzbekistanVanuatuVenezuela, RBVietnamVirgin Islands (U.S.)West Bank and GazaWorldYemen, Rep.ZambiaZimbabwe Timeline:
This timeline shows a graph from 1961 to 2016 of Spain. No data until 1960. Number of actual observations by date: 56.
Source name:
World Development Indicators
Source organization:
World Bank Staff estimates based on United Nations, World Urbanization Prospects.
Categories, topics:
Agriculture & Rural Development
Last updated:
apr 23, 2017
Indicators value changes by year
Minimum:
-1.673
jan 1, 1970
At the date of observation
Value
Absolute change
Change from previous value
jan 1, 1961
0.05
+0.05
0.0%
jan 1, 1962
-0.78
-0.83
-1.66K%
jan 1, 1963
-1.462
-0.682
87.41%
jan 1, 1964
-1.546
-0.084
5.74%
jan 1, 1965
-1.474
+0.072
-4.63%
jan 1, 1966
-1.414
+0.061
-4.12%
jan 1, 1967
-1.521
-0.107
7.59%
jan 1, 1968
-1.353
+0.167
-11.0%
jan 1, 1969
-1.32
+0.034
-2.48%
jan 1, 1970
-1.673
-0.353
26.74%
jan 1, 1971
-1.591
+0.082
-4.9%
jan 1, 1972
-1.305
+0.286
-17.99%
jan 1, 1973
-1.207
+0.098
-7.49%
jan 1, 1974
-1.22
-0.013
1.05%
jan 1, 1975
-1.19
+0.03
-2.47%
jan 1, 1976
-1.11
+0.08
-6.71%
jan 1, 1977
-1.052
+0.057
-5.16%
jan 1, 1978
-1.024
+0.029
-2.75%
jan 1, 1979
-0.865
+0.159
-15.53%
jan 1, 1980
-1.368
-0.504
58.25%
jan 1, 1981
-1.641
-0.272
19.91%
jan 1, 1982
-1.015
+0.626
-38.13%
jan 1, 1983
-0.353
+0.662
-65.26%
jan 1, 1984
-0.415
-0.062
17.72%
jan 1, 1985
-0.483
-0.068
16.29%
jan 1, 1986
-0.526
-0.043
8.97%
jan 1, 1987
-0.596
-0.07
13.34%
jan 1, 1988
-0.653
-0.057
9.57%
jan 1, 1989
-0.68
-0.027
4.15%
jan 1, 1990
-0.709
-0.029
4.24%
jan 1, 1991
-0.757
-0.047
6.69%
jan 1, 1992
-0.493
+0.264
-34.88%
jan 1, 1993
-0.006
+0.487
-98.85%
jan 1, 1994
-0.026
-0.02
355.52%
jan 1, 1995
-0.069
-0.043
166.36%
jan 1, 1996
-0.105
-0.036
52.54%
jan 1, 1997
-0.109
-0.004
3.73%
jan 1, 1998
-0.074
+0.035
-32.53%
jan 1, 1999
0.011
+0.085
-115.57%
jan 1, 2000
0.176
+0.164
1.43K%
jan 1, 2001
0.5
+0.324
184.45%
jan 1, 2002
0.875
+0.375
75.03%
jan 1, 2003
0.838
-0.037
-4.24%
jan 1, 2004
0.759
-0.079
-9.39%
jan 1, 2005
0.669
-0.09
-11.83%
jan 1, 2006
0.635
-0.034
-5.11%
jan 1, 2007
0.634
-0.001
-0.21%
jan 1, 2008
0.788
+0.154
24.29%
jan 1, 2009
0.529
-0.258
-32.77%
jan 1, 2010
-0.182
-0.712
-134.45%
jan 1, 2011
-0.61
-0.428
234.4%
jan 1, 2012
-0.722
-0.112
18.35%
jan 1, 2013
-1.015
-0.293
40.54%
jan 1, 2014
-1.409
-0.395
38.91%
jan 1, 2015
-1.388
+0.022
-1.54%
jan 1, 2016
-1.226
+0.162
-11.67%
Ranking of countries by current statistics by years


Comments: