29
/
en
AIzaSyAYiBZKx7MnpbEhh9jyipgxe19OcubqV5w
April 1, 2024
207408
Nepal
NPL
true
2
1
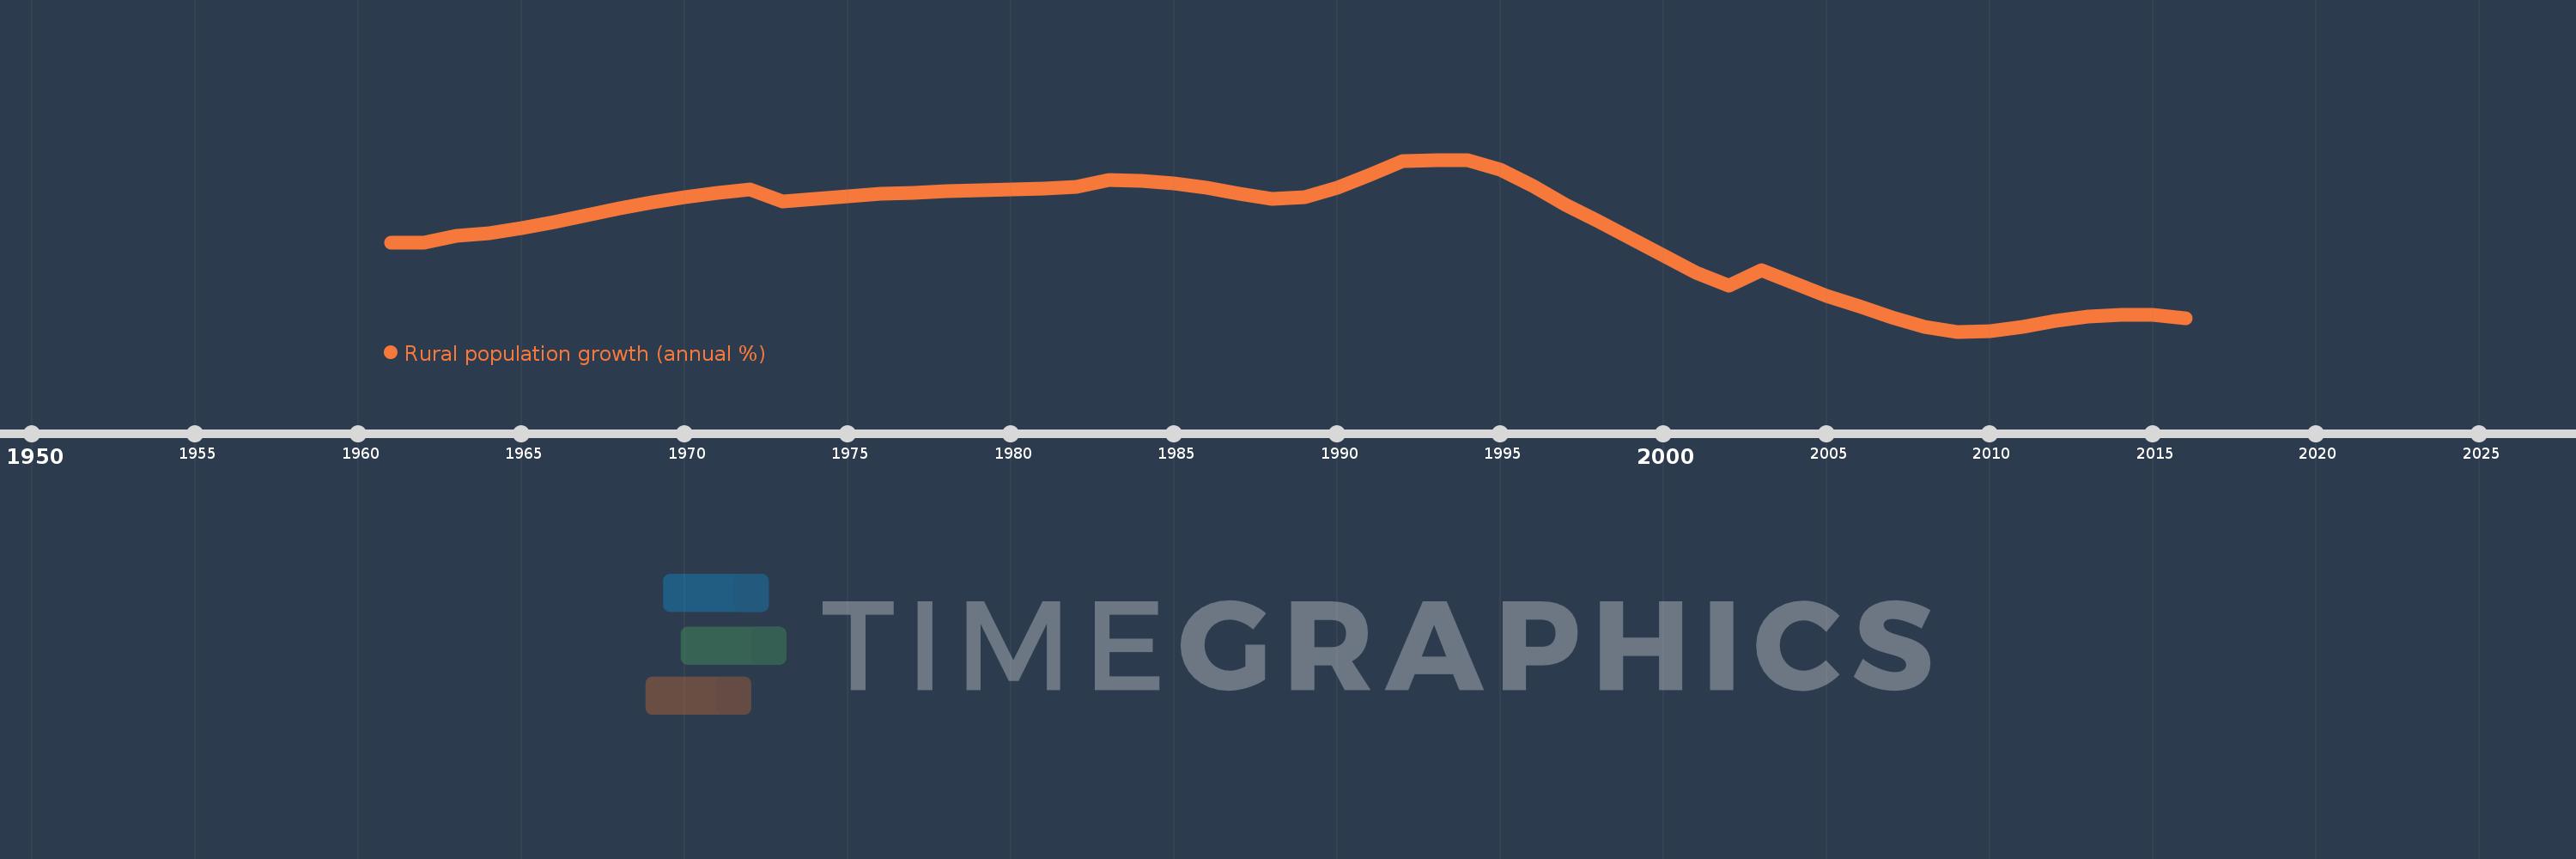
Rural population growth (annual %)
2016,2015,2014,2013,2012,2011,2010,2009,2008,2007,2006,2005,2004,2003,2002,2001,2000,1999,1998,1997,1996,1995,1994,1993,1992,1991,1990,1989,1988,1987,1986,1985,1984,1983,1982,1981,1980,1979,1978,1977,1976,1975,1974,1973,1972,1971,1970,1969,1968,1967,1966,1965,1964,1963,1962,1961
This statistics in other country:
AfghanistanAlbaniaAlgeriaAmerican SamoaAndorraAngolaAntigua and BarbudaArab WorldArgentinaArmeniaArubaAustraliaAustriaAzerbaijanBahamas, TheBahrainBangladeshBarbadosBelarusBelgiumBelizeBeninBhutanBoliviaBosnia and HerzegovinaBotswanaBrazilBritish Virgin IslandsBrunei DarussalamBulgariaBurkina FasoBurundiCabo VerdeCambodiaCameroonCanadaCaribbean small statesCentral African RepublicCentral Europe and the BalticsChadChannel IslandsChileChinaColombiaComorosCongo, Dem. Rep.Congo, Rep.Costa RicaCote d'IvoireCroatiaCubaCuracaoCyprusCzech RepublicDenmarkDjiboutiDominicaDominican RepublicEarly-demographic dividendEast Asia & PacificEast Asia & Pacific (excluding high income)East Asia & Pacific (IDA & IBRD countries)EcuadorEgypt, Arab Rep.El SalvadorEquatorial GuineaEritreaEstoniaEthiopiaEuro areaEurope & Central AsiaEurope & Central Asia (excluding high income)Europe & Central Asia (IDA & IBRD countries)European UnionFaroe IslandsFijiFinlandFragile and conflict affected situationsFranceFrench PolynesiaGabonGambia, TheGeorgiaGermanyGhanaGreeceGreenlandGrenadaGuamGuatemalaGuineaGuinea-BissauGuyanaHaitiHeavily indebted poor countries (HIPC)High incomeHondurasHong Kong SAR, ChinaHungaryIBRD onlyIcelandIDA & IBRD totalIDA blendIDA onlyIDA totalIndiaIndonesiaIran, Islamic Rep.IraqIrelandIsle of ManIsraelItalyJamaicaJapanJordanKazakhstanKenyaKiribatiKorea, Dem. People’s Rep.Korea, Rep.KuwaitKyrgyz RepublicLao PDRLate-demographic dividendLatin America & Caribbean Latin America & Caribbean (excluding high income)Latin America & the Caribbean (IDA & IBRD countries)LatviaLeast developed countries: UN classificationLebanonLesothoLiberiaLibyaLiechtensteinLithuaniaLow & middle incomeLow incomeLower middle incomeLuxembourgMacao SAR, ChinaMacedonia, FYRMadagascarMalawiMalaysiaMaldivesMaliMaltaMarshall IslandsMauritaniaMauritiusMexicoMicronesia, Fed. Sts.Middle East & North AfricaMiddle East & North Africa (excluding high income)Middle East & North Africa (IDA & IBRD countries)Middle incomeMoldovaMongoliaMontenegroMoroccoMozambiqueMyanmarNamibiaNauruNepalNetherlandsNew CaledoniaNew ZealandNicaraguaNigerNigeriaNorth AmericaNorthern Mariana IslandsNorwayOECD membersOmanOther small statesPacific island small statesPakistanPalauPanamaPapua New GuineaParaguayPeruPhilippinesPolandPortugalPost-demographic dividendPre-demographic dividendPuerto RicoQatarRomaniaRussian FederationRwandaSamoaSan MarinoSao Tome and PrincipeSaudi ArabiaSenegalSerbiaSeychellesSierra LeoneSlovak RepublicSloveniaSmall statesSolomon IslandsSomaliaSouth AfricaSouth AsiaSouth Asia (IDA & IBRD)South SudanSpainSri LankaSt. Kitts and NevisSt. LuciaSt. Vincent and the GrenadinesSub-Saharan Africa Sub-Saharan Africa (excluding high income)Sub-Saharan Africa (IDA & IBRD countries)SudanSurinameSwazilandSwedenSwitzerlandSyrian Arab RepublicTajikistanTanzaniaThailandTimor-LesteTogoTongaTrinidad and TobagoTunisiaTurkeyTurkmenistanTurks and Caicos IslandsTuvaluUgandaUkraineUnited Arab EmiratesUnited KingdomUnited StatesUpper middle incomeUruguayUzbekistanVanuatuVenezuela, RBVietnamVirgin Islands (U.S.)West Bank and GazaWorldYemen, Rep.ZambiaZimbabwe Timeline:
This timeline shows a graph from 1961 to 2016 of Nepal. No data until 1960. Number of actual observations by date: 56.
Source name:
World Development Indicators
Source organization:
World Bank Staff estimates based on United Nations, World Urbanization Prospects.
Categories, topics:
Agriculture & Rural Development
Last updated:
apr 23, 2017
Indicators value changes by year
At the date of observation
Value
Absolute change
Change from previous value
jan 1, 1961
1.468
+1.468
0.0%
jan 1, 1962
1.467
-0.001
-0.09%
jan 1, 1963
1.53
+0.063
4.33%
jan 1, 1964
1.559
+0.029
1.89%
jan 1, 1965
1.606
+0.047
3.03%
jan 1, 1966
1.668
+0.061
3.82%
jan 1, 1967
1.734
+0.066
3.96%
jan 1, 1968
1.798
+0.064
3.72%
jan 1, 1969
1.855
+0.057
3.17%
jan 1, 1970
1.903
+0.048
2.58%
jan 1, 1971
1.942
+0.039
2.06%
jan 1, 1972
1.976
+0.034
1.75%
jan 1, 1973
1.865
-0.112
-5.65%
jan 1, 1974
1.892
+0.027
1.46%
jan 1, 1975
1.914
+0.022
1.19%
jan 1, 1976
1.935
+0.021
1.08%
jan 1, 1977
1.95
+0.015
0.78%
jan 1, 1978
1.963
+0.013
0.67%
jan 1, 1979
1.974
+0.011
0.58%
jan 1, 1980
1.982
+0.008
0.4%
jan 1, 1981
1.988
+0.006
0.29%
jan 1, 1982
2.001
+0.013
0.66%
jan 1, 1983
2.07
+0.069
3.45%
jan 1, 1984
2.065
-0.006
-0.27%
jan 1, 1985
2.036
-0.029
-1.4%
jan 1, 1986
1.997
-0.039
-1.9%
jan 1, 1987
1.938
-0.059
-2.96%
jan 1, 1988
1.892
-0.046
-2.37%
jan 1, 1989
1.905
+0.013
0.7%
jan 1, 1990
1.994
+0.089
4.67%
jan 1, 1991
2.122
+0.128
6.4%
jan 1, 1992
2.252
+0.13
6.13%
jan 1, 1993
2.262
+0.01
0.45%
jan 1, 1994
2.265
+0.003
0.12%
jan 1, 1995
2.169
-0.096
-4.22%
jan 1, 1996
2.009
-0.16
-7.39%
jan 1, 1997
1.833
-0.176
-8.78%
jan 1, 1998
1.673
-0.16
-8.73%
jan 1, 1999
1.507
-0.166
-9.92%
jan 1, 2000
1.342
-0.165
-10.94%
jan 1, 2001
1.179
-0.163
-12.11%
jan 1, 2002
1.053
-0.126
-10.7%
jan 1, 2003
1.201
+0.148
14.04%
jan 1, 2004
1.074
-0.127
-10.61%
jan 1, 2005
0.955
-0.118
-11.03%
jan 1, 2006
0.851
-0.105
-10.96%
jan 1, 2007
0.746
-0.104
-12.24%
jan 1, 2008
0.657
-0.09
-12.01%
jan 1, 2009
0.608
-0.049
-7.4%
jan 1, 2010
0.613
+0.005
0.8%
jan 1, 2011
0.653
+0.04
6.48%
jan 1, 2012
0.708
+0.055
8.44%
jan 1, 2013
0.749
+0.041
5.85%
jan 1, 2014
0.773
+0.023
3.12%
jan 1, 2015
0.767
-0.006
-0.8%
jan 1, 2016
0.74
-0.027
-3.47%
Ranking of countries by current statistics by years


Comments: