29
/
en
AIzaSyAYiBZKx7MnpbEhh9jyipgxe19OcubqV5w
April 1, 2024
188463
Malaysia
MYS
true
2
1
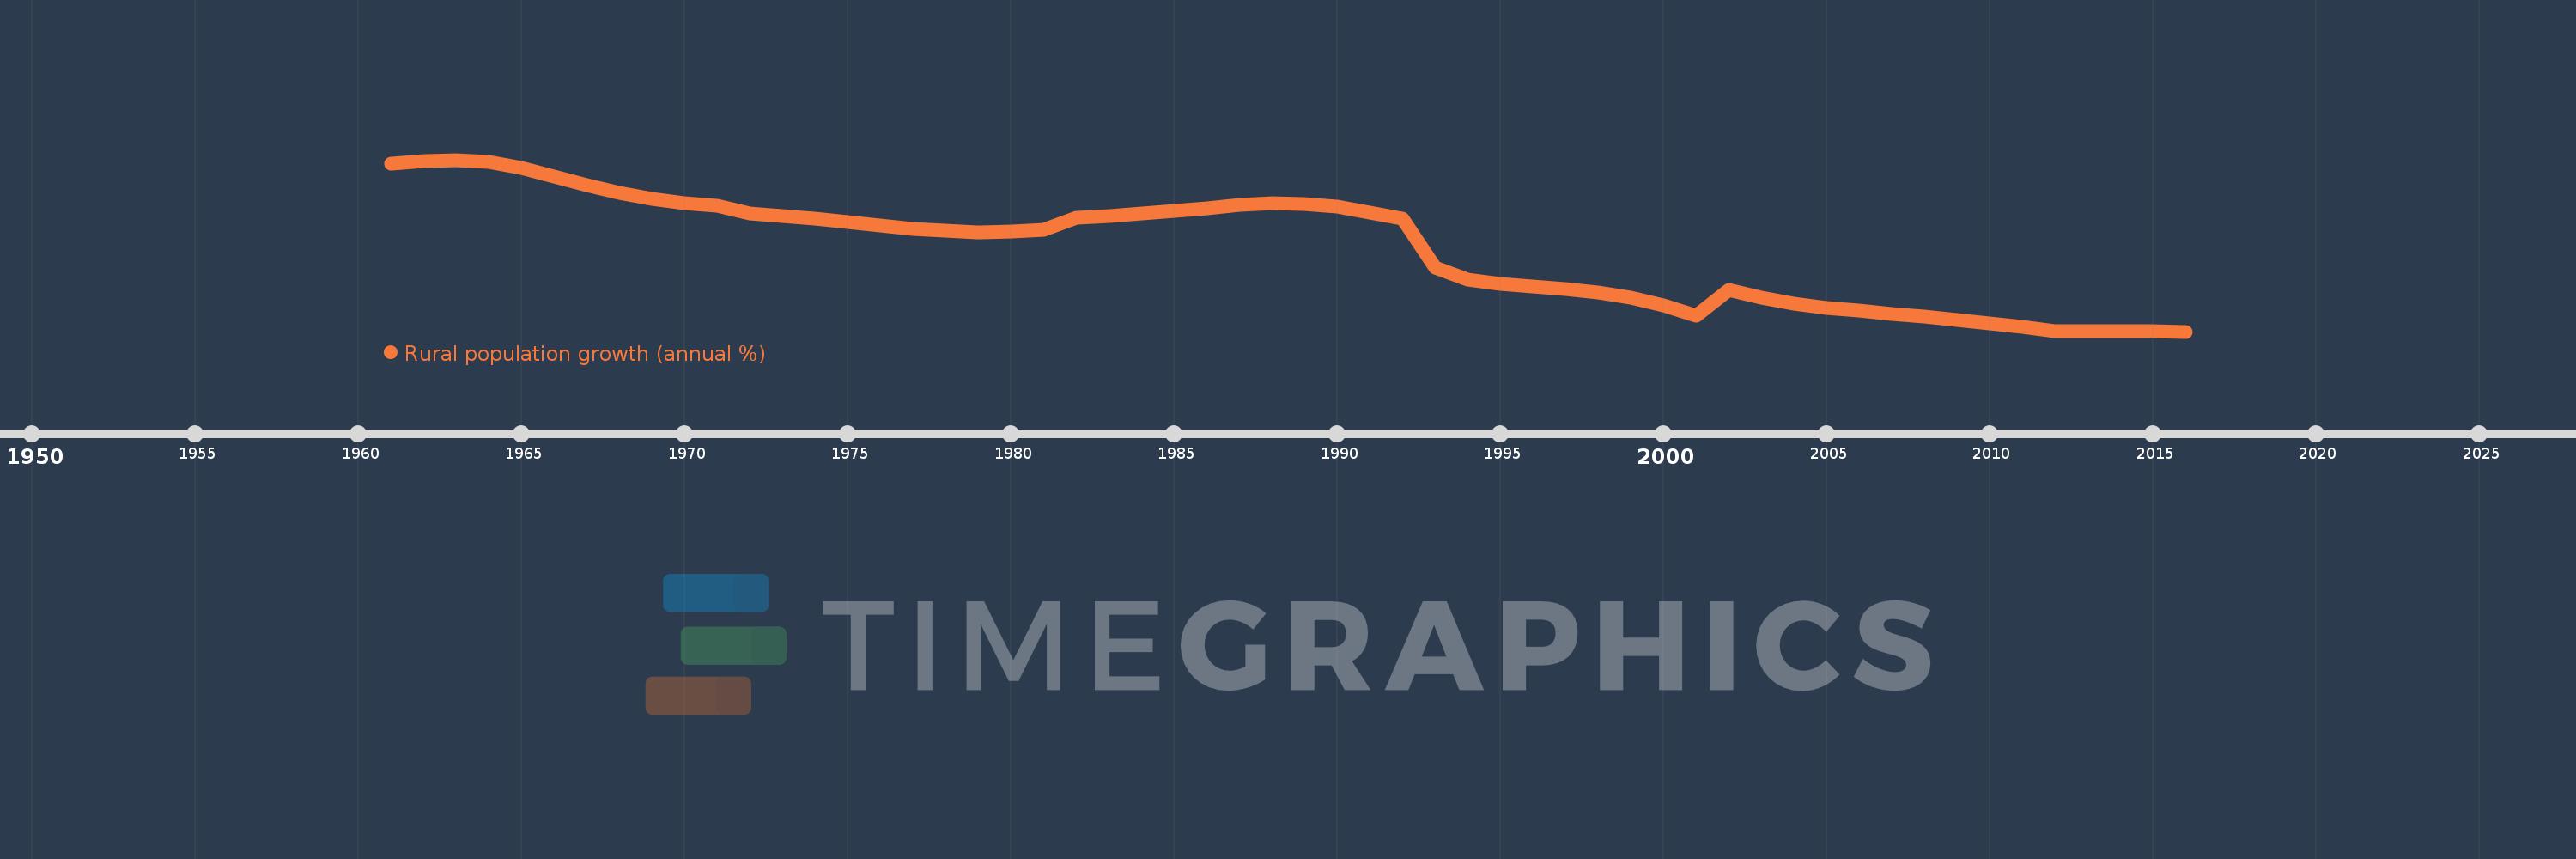
Rural population growth (annual %)
2016,2015,2014,2013,2012,2011,2010,2009,2008,2007,2006,2005,2004,2003,2002,2001,2000,1999,1998,1997,1996,1995,1994,1993,1992,1991,1990,1989,1988,1987,1986,1985,1984,1983,1982,1981,1980,1979,1978,1977,1976,1975,1974,1973,1972,1971,1970,1969,1968,1967,1966,1965,1964,1963,1962,1961
This statistics in other country:
AfghanistanAlbaniaAlgeriaAmerican SamoaAndorraAngolaAntigua and BarbudaArab WorldArgentinaArmeniaArubaAustraliaAustriaAzerbaijanBahamas, TheBahrainBangladeshBarbadosBelarusBelgiumBelizeBeninBhutanBoliviaBosnia and HerzegovinaBotswanaBrazilBritish Virgin IslandsBrunei DarussalamBulgariaBurkina FasoBurundiCabo VerdeCambodiaCameroonCanadaCaribbean small statesCentral African RepublicCentral Europe and the BalticsChadChannel IslandsChileChinaColombiaComorosCongo, Dem. Rep.Congo, Rep.Costa RicaCote d'IvoireCroatiaCubaCuracaoCyprusCzech RepublicDenmarkDjiboutiDominicaDominican RepublicEarly-demographic dividendEast Asia & PacificEast Asia & Pacific (excluding high income)East Asia & Pacific (IDA & IBRD countries)EcuadorEgypt, Arab Rep.El SalvadorEquatorial GuineaEritreaEstoniaEthiopiaEuro areaEurope & Central AsiaEurope & Central Asia (excluding high income)Europe & Central Asia (IDA & IBRD countries)European UnionFaroe IslandsFijiFinlandFragile and conflict affected situationsFranceFrench PolynesiaGabonGambia, TheGeorgiaGermanyGhanaGreeceGreenlandGrenadaGuamGuatemalaGuineaGuinea-BissauGuyanaHaitiHeavily indebted poor countries (HIPC)High incomeHondurasHong Kong SAR, ChinaHungaryIBRD onlyIcelandIDA & IBRD totalIDA blendIDA onlyIDA totalIndiaIndonesiaIran, Islamic Rep.IraqIrelandIsle of ManIsraelItalyJamaicaJapanJordanKazakhstanKenyaKiribatiKorea, Dem. People’s Rep.Korea, Rep.KuwaitKyrgyz RepublicLao PDRLate-demographic dividendLatin America & Caribbean Latin America & Caribbean (excluding high income)Latin America & the Caribbean (IDA & IBRD countries)LatviaLeast developed countries: UN classificationLebanonLesothoLiberiaLibyaLiechtensteinLithuaniaLow & middle incomeLow incomeLower middle incomeLuxembourgMacao SAR, ChinaMacedonia, FYRMadagascarMalawiMalaysiaMaldivesMaliMaltaMarshall IslandsMauritaniaMauritiusMexicoMicronesia, Fed. Sts.Middle East & North AfricaMiddle East & North Africa (excluding high income)Middle East & North Africa (IDA & IBRD countries)Middle incomeMoldovaMongoliaMontenegroMoroccoMozambiqueMyanmarNamibiaNauruNepalNetherlandsNew CaledoniaNew ZealandNicaraguaNigerNigeriaNorth AmericaNorthern Mariana IslandsNorwayOECD membersOmanOther small statesPacific island small statesPakistanPalauPanamaPapua New GuineaParaguayPeruPhilippinesPolandPortugalPost-demographic dividendPre-demographic dividendPuerto RicoQatarRomaniaRussian FederationRwandaSamoaSan MarinoSao Tome and PrincipeSaudi ArabiaSenegalSerbiaSeychellesSierra LeoneSlovak RepublicSloveniaSmall statesSolomon IslandsSomaliaSouth AfricaSouth AsiaSouth Asia (IDA & IBRD)South SudanSpainSri LankaSt. Kitts and NevisSt. LuciaSt. Vincent and the GrenadinesSub-Saharan Africa Sub-Saharan Africa (excluding high income)Sub-Saharan Africa (IDA & IBRD countries)SudanSurinameSwazilandSwedenSwitzerlandSyrian Arab RepublicTajikistanTanzaniaThailandTimor-LesteTogoTongaTrinidad and TobagoTunisiaTurkeyTurkmenistanTurks and Caicos IslandsTuvaluUgandaUkraineUnited Arab EmiratesUnited KingdomUnited StatesUpper middle incomeUruguayUzbekistanVanuatuVenezuela, RBVietnamVirgin Islands (U.S.)West Bank and GazaWorldYemen, Rep.ZambiaZimbabwe Timeline:
This timeline shows a graph from 1961 to 2016 of Malaysia. No data until 1960. Number of actual observations by date: 56.
Source name:
World Development Indicators
Source organization:
World Bank Staff estimates based on United Nations, World Urbanization Prospects.
Categories, topics:
Agriculture & Rural Development
Last updated:
apr 23, 2017
Indicators value changes by year
Minimum:
-1.286
jan 1, 2016
At the date of observation
Value
Absolute change
Change from previous value
jan 1, 1961
2.289
+2.289
0.0%
jan 1, 1962
2.356
+0.067
2.92%
jan 1, 1963
2.38
+0.024
1.01%
jan 1, 1964
2.335
-0.044
-1.87%
jan 1, 1965
2.204
-0.131
-5.61%
jan 1, 1966
2.028
-0.177
-8.01%
jan 1, 1967
1.836
-0.192
-9.48%
jan 1, 1968
1.67
-0.165
-9.0%
jan 1, 1969
1.539
-0.131
-7.84%
jan 1, 1970
1.458
-0.081
-5.27%
jan 1, 1971
1.407
-0.052
-3.54%
jan 1, 1972
1.24
-0.166
-11.81%
jan 1, 1973
1.18
-0.06
-4.85%
jan 1, 1974
1.126
-0.054
-4.59%
jan 1, 1975
1.055
-0.071
-6.34%
jan 1, 1976
0.982
-0.072
-6.86%
jan 1, 1977
0.911
-0.071
-7.27%
jan 1, 1978
0.863
-0.048
-5.25%
jan 1, 1979
0.838
-0.025
-2.94%
jan 1, 1980
0.847
+0.009
1.09%
jan 1, 1981
0.892
+0.045
5.34%
jan 1, 1982
1.148
+0.256
28.64%
jan 1, 1983
1.181
+0.033
2.9%
jan 1, 1984
1.226
+0.045
3.83%
jan 1, 1985
1.286
+0.059
4.85%
jan 1, 1986
1.352
+0.066
5.12%
jan 1, 1987
1.412
+0.06
4.48%
jan 1, 1988
1.455
+0.043
3.04%
jan 1, 1989
1.442
-0.013
-0.91%
jan 1, 1990
1.375
-0.066
-4.59%
jan 1, 1991
1.261
-0.114
-8.31%
jan 1, 1992
1.132
-0.129
-10.24%
jan 1, 1993
0.074
-1.058
-93.48%
jan 1, 1994
-0.174
-0.248
-335.81%
jan 1, 1995
-0.264
-0.09
51.68%
jan 1, 1996
-0.323
-0.059
22.3%
jan 1, 1997
-0.382
-0.06
18.46%
jan 1, 1998
-0.45
-0.067
17.56%
jan 1, 1999
-0.57
-0.121
26.83%
jan 1, 2000
-0.736
-0.166
29.07%
jan 1, 2001
-0.942
-0.206
27.93%
jan 1, 2002
-0.403
+0.538
-57.15%
jan 1, 2003
-0.56
-0.157
38.89%
jan 1, 2004
-0.692
-0.132
23.52%
jan 1, 2005
-0.786
-0.094
13.6%
jan 1, 2006
-0.843
-0.057
7.2%
jan 1, 2007
-0.903
-0.06
7.16%
jan 1, 2008
-0.969
-0.066
7.31%
jan 1, 2009
-1.041
-0.071
7.34%
jan 1, 2010
-1.111
-0.07
6.73%
jan 1, 2011
-1.193
-0.082
7.41%
jan 1, 2012
-1.27
-0.077
6.49%
jan 1, 2013
-1.279
-0.009
0.71%
jan 1, 2014
-1.281
-0.002
0.16%
jan 1, 2015
-1.284
-0.003
0.21%
jan 1, 2016
-1.286
-0.002
0.14%
Ranking of countries by current statistics by years


Comments: