29
/
en
AIzaSyAYiBZKx7MnpbEhh9jyipgxe19OcubqV5w
April 1, 2024
158932
Iraq
IRQ
true
2
1
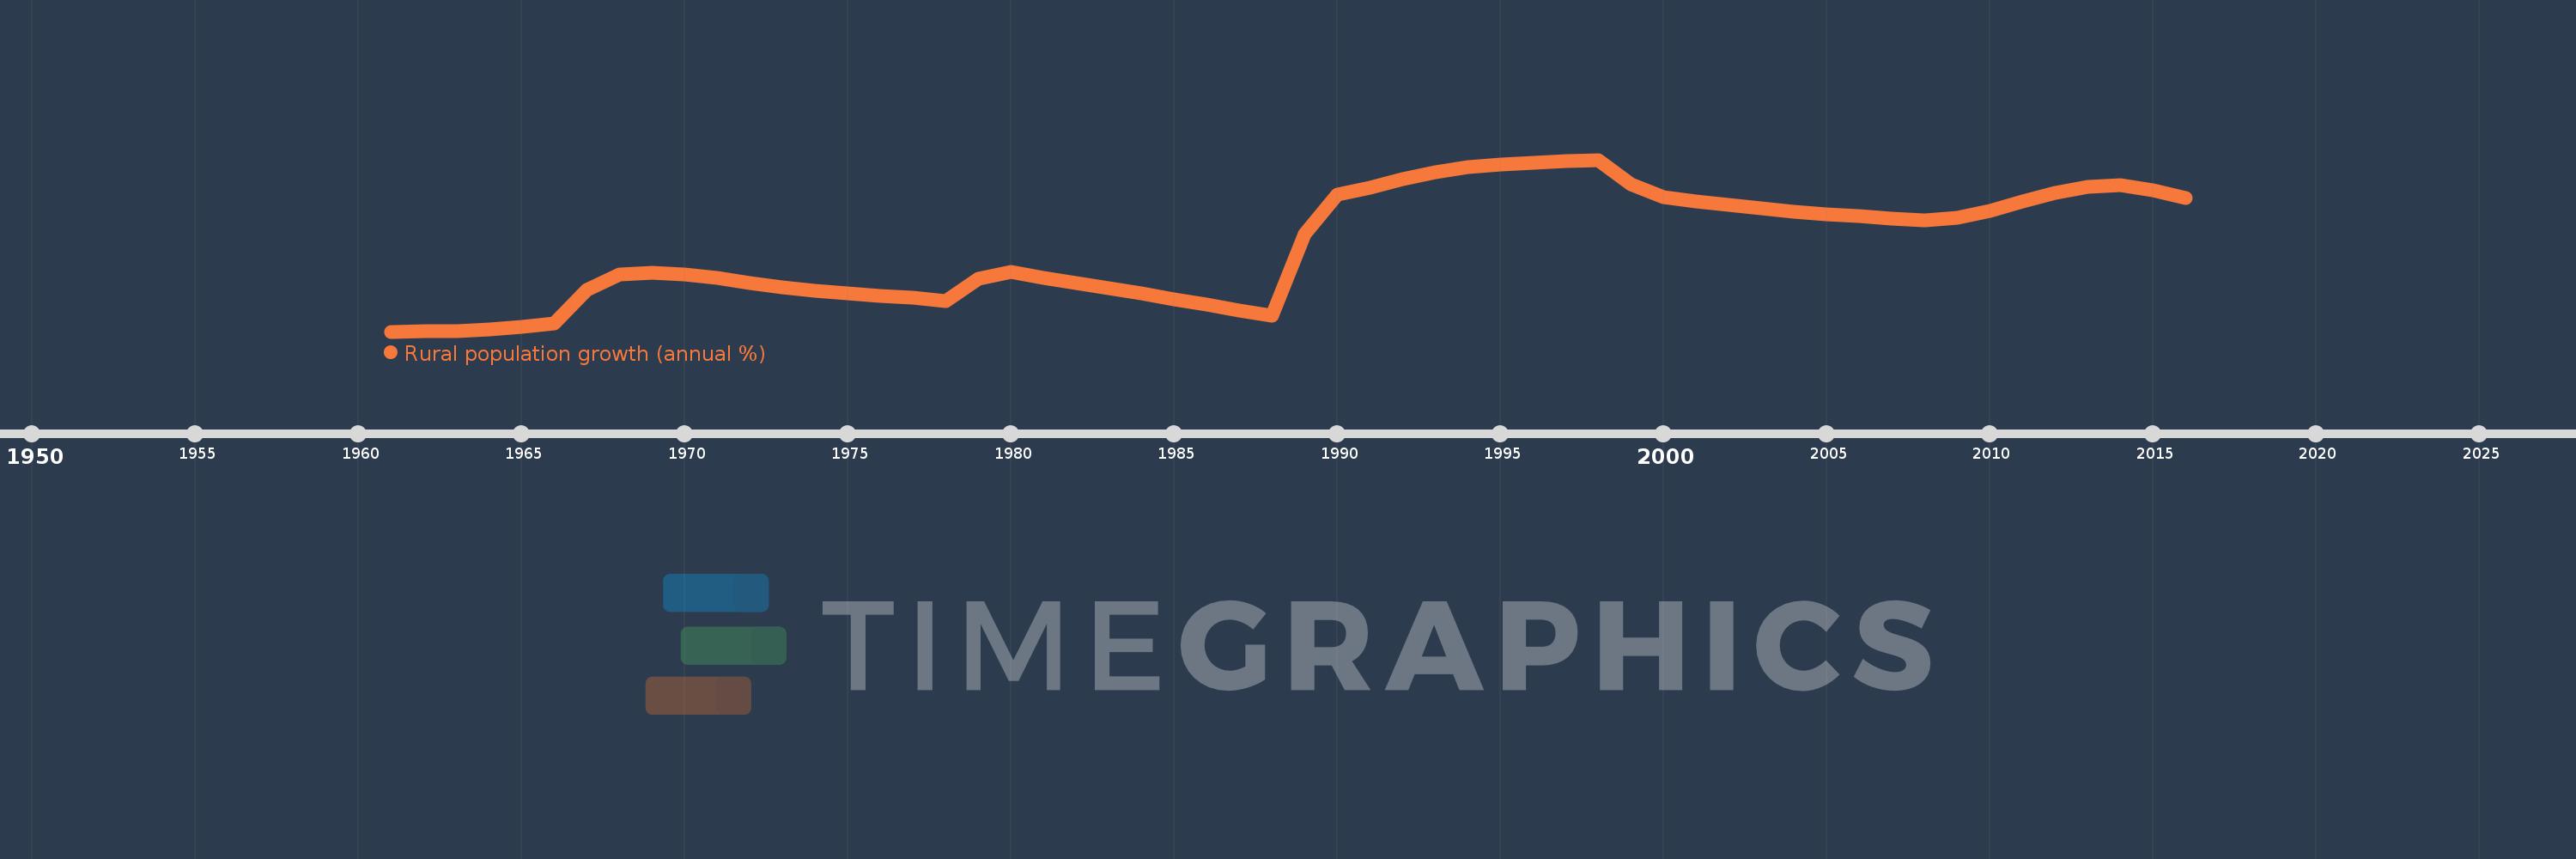
Rural population growth (annual %)
2016,2015,2014,2013,2012,2011,2010,2009,2008,2007,2006,2005,2004,2003,2002,2001,2000,1999,1998,1997,1996,1995,1994,1993,1992,1991,1990,1989,1988,1987,1986,1985,1984,1983,1982,1981,1980,1979,1978,1977,1976,1975,1974,1973,1972,1971,1970,1969,1968,1967,1966,1965,1964,1963,1962,1961
This statistics in other country:
AfghanistanAlbaniaAlgeriaAmerican SamoaAndorraAngolaAntigua and BarbudaArab WorldArgentinaArmeniaArubaAustraliaAustriaAzerbaijanBahamas, TheBahrainBangladeshBarbadosBelarusBelgiumBelizeBeninBhutanBoliviaBosnia and HerzegovinaBotswanaBrazilBritish Virgin IslandsBrunei DarussalamBulgariaBurkina FasoBurundiCabo VerdeCambodiaCameroonCanadaCaribbean small statesCentral African RepublicCentral Europe and the BalticsChadChannel IslandsChileChinaColombiaComorosCongo, Dem. Rep.Congo, Rep.Costa RicaCote d'IvoireCroatiaCubaCuracaoCyprusCzech RepublicDenmarkDjiboutiDominicaDominican RepublicEarly-demographic dividendEast Asia & PacificEast Asia & Pacific (excluding high income)East Asia & Pacific (IDA & IBRD countries)EcuadorEgypt, Arab Rep.El SalvadorEquatorial GuineaEritreaEstoniaEthiopiaEuro areaEurope & Central AsiaEurope & Central Asia (excluding high income)Europe & Central Asia (IDA & IBRD countries)European UnionFaroe IslandsFijiFinlandFragile and conflict affected situationsFranceFrench PolynesiaGabonGambia, TheGeorgiaGermanyGhanaGreeceGreenlandGrenadaGuamGuatemalaGuineaGuinea-BissauGuyanaHaitiHeavily indebted poor countries (HIPC)High incomeHondurasHong Kong SAR, ChinaHungaryIBRD onlyIcelandIDA & IBRD totalIDA blendIDA onlyIDA totalIndiaIndonesiaIran, Islamic Rep.IraqIrelandIsle of ManIsraelItalyJamaicaJapanJordanKazakhstanKenyaKiribatiKorea, Dem. People’s Rep.Korea, Rep.KuwaitKyrgyz RepublicLao PDRLate-demographic dividendLatin America & Caribbean Latin America & Caribbean (excluding high income)Latin America & the Caribbean (IDA & IBRD countries)LatviaLeast developed countries: UN classificationLebanonLesothoLiberiaLibyaLiechtensteinLithuaniaLow & middle incomeLow incomeLower middle incomeLuxembourgMacao SAR, ChinaMacedonia, FYRMadagascarMalawiMalaysiaMaldivesMaliMaltaMarshall IslandsMauritaniaMauritiusMexicoMicronesia, Fed. Sts.Middle East & North AfricaMiddle East & North Africa (excluding high income)Middle East & North Africa (IDA & IBRD countries)Middle incomeMoldovaMongoliaMontenegroMoroccoMozambiqueMyanmarNamibiaNauruNepalNetherlandsNew CaledoniaNew ZealandNicaraguaNigerNigeriaNorth AmericaNorthern Mariana IslandsNorwayOECD membersOmanOther small statesPacific island small statesPakistanPalauPanamaPapua New GuineaParaguayPeruPhilippinesPolandPortugalPost-demographic dividendPre-demographic dividendPuerto RicoQatarRomaniaRussian FederationRwandaSamoaSan MarinoSao Tome and PrincipeSaudi ArabiaSenegalSerbiaSeychellesSierra LeoneSlovak RepublicSloveniaSmall statesSolomon IslandsSomaliaSouth AfricaSouth AsiaSouth Asia (IDA & IBRD)South SudanSpainSri LankaSt. Kitts and NevisSt. LuciaSt. Vincent and the GrenadinesSub-Saharan Africa Sub-Saharan Africa (excluding high income)Sub-Saharan Africa (IDA & IBRD countries)SudanSurinameSwazilandSwedenSwitzerlandSyrian Arab RepublicTajikistanTanzaniaThailandTimor-LesteTogoTongaTrinidad and TobagoTunisiaTurkeyTurkmenistanTurks and Caicos IslandsTuvaluUgandaUkraineUnited Arab EmiratesUnited KingdomUnited StatesUpper middle incomeUruguayUzbekistanVanuatuVenezuela, RBVietnamVirgin Islands (U.S.)West Bank and GazaWorldYemen, Rep.ZambiaZimbabwe Timeline:
This timeline shows a graph from 1961 to 2016 of Iraq. No data until 1960. Number of actual observations by date: 56.
Source name:
World Development Indicators
Source organization:
World Bank Staff estimates based on United Nations, World Urbanization Prospects.
Categories, topics:
Agriculture & Rural Development
Last updated:
apr 23, 2017
Indicators value changes by year
Minimum:
-0.215
jan 1, 1961
At the date of observation
Value
Absolute change
Change from previous value
jan 1, 1961
-0.215
-0.215
0.0%
jan 1, 1962
-0.207
+0.007
-3.4%
jan 1, 1963
-0.196
+0.011
-5.4%
jan 1, 1964
-0.16
+0.036
-18.61%
jan 1, 1965
-0.106
+0.054
-33.56%
jan 1, 1966
-0.034
+0.072
-68.09%
jan 1, 1967
0.738
+0.772
-2.28K%
jan 1, 1968
1.104
+0.366
49.6%
jan 1, 1969
1.13
+0.027
2.41%
jan 1, 1970
1.096
-0.035
-3.07%
jan 1, 1971
1.009
-0.087
-7.91%
jan 1, 1972
0.903
-0.106
-10.5%
jan 1, 1973
0.802
-0.101
-11.21%
jan 1, 1974
0.727
-0.075
-9.33%
jan 1, 1975
0.66
-0.067
-9.2%
jan 1, 1976
0.611
-0.049
-7.45%
jan 1, 1977
0.556
-0.055
-8.94%
jan 1, 1978
0.491
-0.065
-11.73%
jan 1, 1979
1.008
+0.517
105.26%
jan 1, 1980
1.154
+0.146
14.45%
jan 1, 1981
1.017
-0.136
-11.83%
jan 1, 1982
0.898
-0.119
-11.69%
jan 1, 1983
0.789
-0.109
-12.14%
jan 1, 1984
0.67
-0.119
-15.11%
jan 1, 1985
0.529
-0.141
-21.0%
jan 1, 1986
0.402
-0.127
-24.03%
jan 1, 1987
0.26
-0.143
-35.45%
jan 1, 1988
0.158
-0.101
-39.07%
jan 1, 1989
2.026
+1.868
1.18K%
jan 1, 1990
2.927
+0.901
44.47%
jan 1, 1991
3.099
+0.172
5.88%
jan 1, 1992
3.284
+0.185
5.98%
jan 1, 1993
3.437
+0.153
4.65%
jan 1, 1994
3.554
+0.117
3.42%
jan 1, 1995
3.63
+0.076
2.13%
jan 1, 1996
3.666
+0.036
0.98%
jan 1, 1997
3.702
+0.037
1.0%
jan 1, 1998
3.731
+0.028
0.77%
jan 1, 1999
3.171
-0.559
-14.99%
jan 1, 2000
2.88
-0.292
-9.19%
jan 1, 2001
2.782
-0.097
-3.38%
jan 1, 2002
2.689
-0.094
-3.37%
jan 1, 2003
2.613
-0.076
-2.83%
jan 1, 2004
2.543
-0.069
-2.65%
jan 1, 2005
2.484
-0.059
-2.32%
jan 1, 2006
2.442
-0.043
-1.73%
jan 1, 2007
2.385
-0.056
-2.3%
jan 1, 2008
2.344
-0.042
-1.74%
jan 1, 2009
2.396
+0.052
2.21%
jan 1, 2010
2.56
+0.164
6.85%
jan 1, 2011
2.776
+0.217
8.46%
jan 1, 2012
2.98
+0.204
7.33%
jan 1, 2013
3.113
+0.133
4.47%
jan 1, 2014
3.146
+0.033
1.06%
jan 1, 2015
3.039
-0.108
-3.43%
jan 1, 2016
2.849
-0.19
-6.25%
Ranking of countries by current statistics by years


Comments: