29
/
en
AIzaSyAYiBZKx7MnpbEhh9jyipgxe19OcubqV5w
April 1, 2024
106617
China
CHN
true
2
1
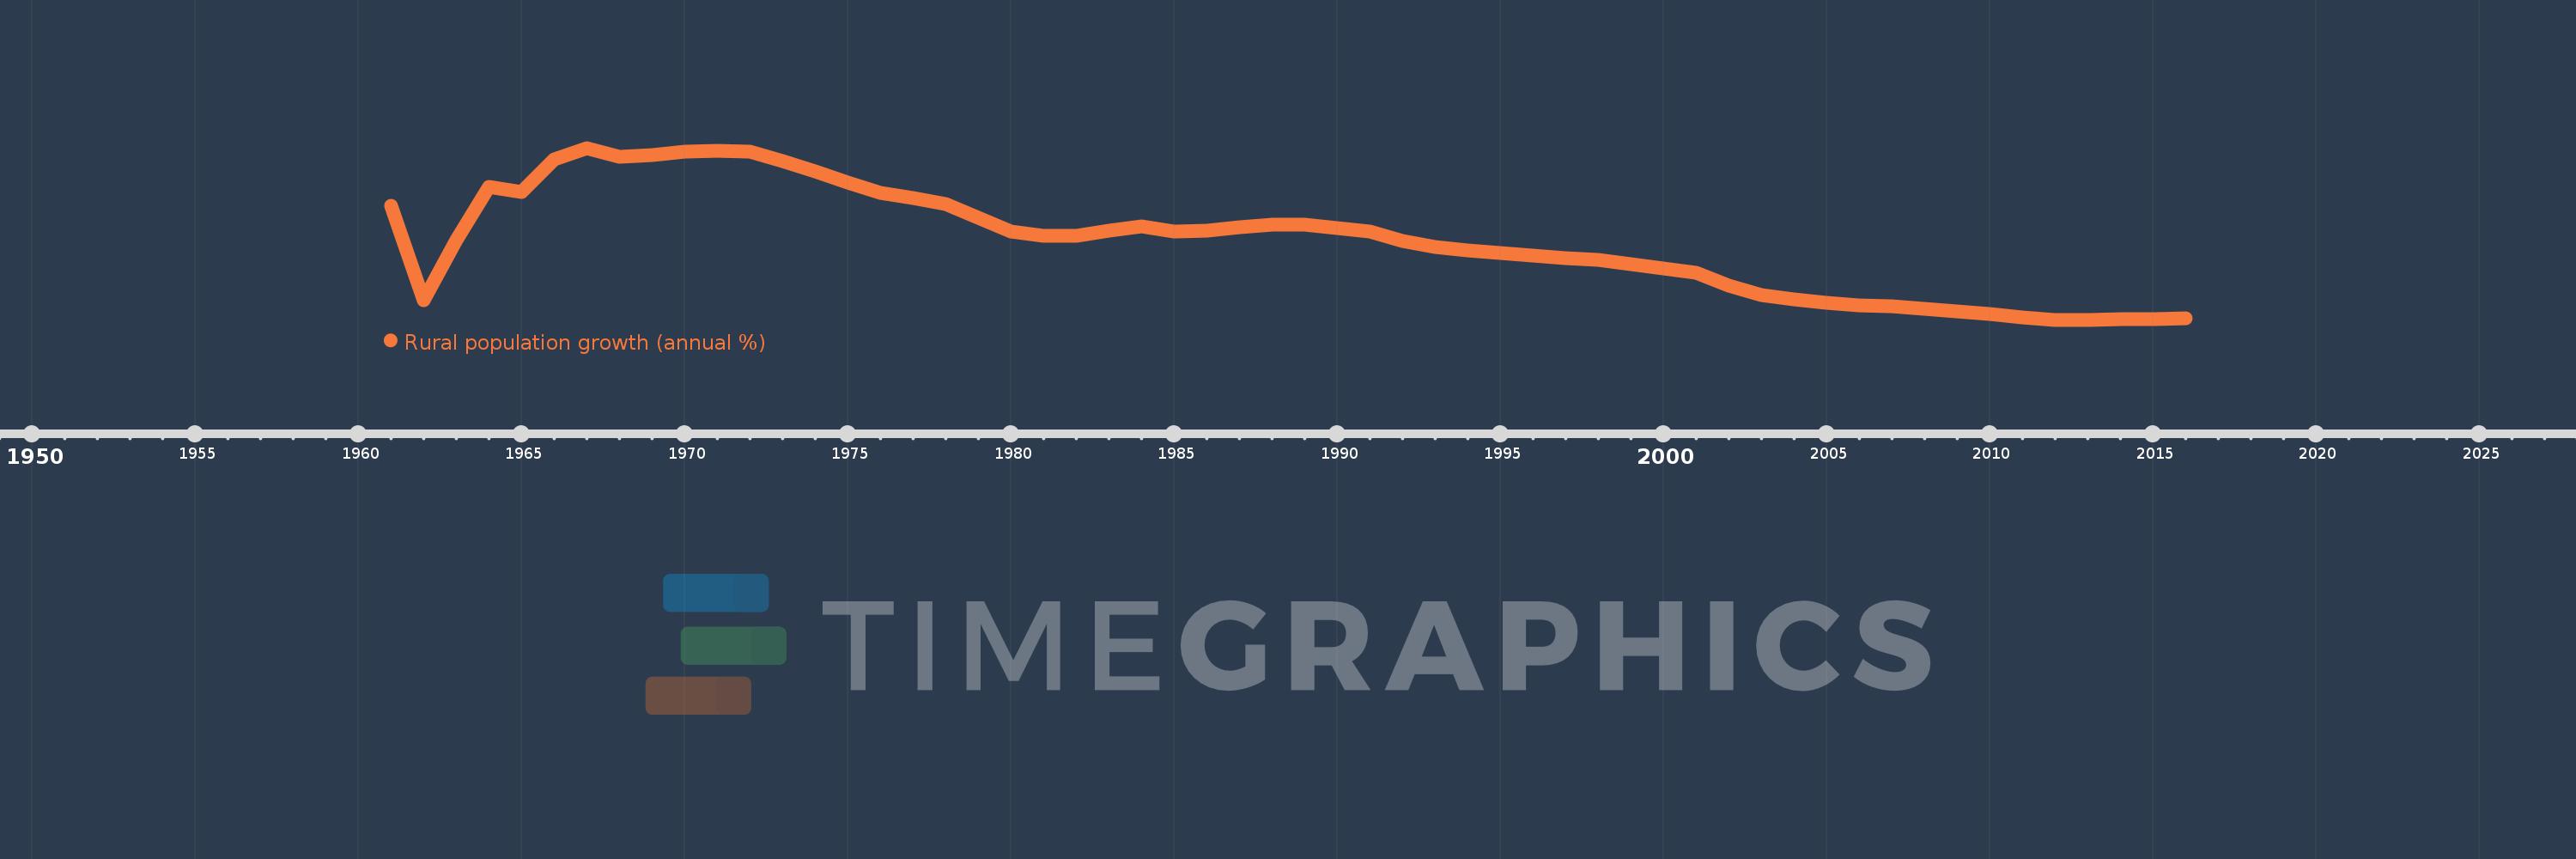
Rural population growth (annual %)
2016,2015,2014,2013,2012,2011,2010,2009,2008,2007,2006,2005,2004,2003,2002,2001,2000,1999,1998,1997,1996,1995,1994,1993,1992,1991,1990,1989,1988,1987,1986,1985,1984,1983,1982,1981,1980,1979,1978,1977,1976,1975,1974,1973,1972,1971,1970,1969,1968,1967,1966,1965,1964,1963,1962,1961
This statistics in other country:
AfghanistanAlbaniaAlgeriaAmerican SamoaAndorraAngolaAntigua and BarbudaArab WorldArgentinaArmeniaArubaAustraliaAustriaAzerbaijanBahamas, TheBahrainBangladeshBarbadosBelarusBelgiumBelizeBeninBhutanBoliviaBosnia and HerzegovinaBotswanaBrazilBritish Virgin IslandsBrunei DarussalamBulgariaBurkina FasoBurundiCabo VerdeCambodiaCameroonCanadaCaribbean small statesCentral African RepublicCentral Europe and the BalticsChadChannel IslandsChileChinaColombiaComorosCongo, Dem. Rep.Congo, Rep.Costa RicaCote d'IvoireCroatiaCubaCuracaoCyprusCzech RepublicDenmarkDjiboutiDominicaDominican RepublicEarly-demographic dividendEast Asia & PacificEast Asia & Pacific (excluding high income)East Asia & Pacific (IDA & IBRD countries)EcuadorEgypt, Arab Rep.El SalvadorEquatorial GuineaEritreaEstoniaEthiopiaEuro areaEurope & Central AsiaEurope & Central Asia (excluding high income)Europe & Central Asia (IDA & IBRD countries)European UnionFaroe IslandsFijiFinlandFragile and conflict affected situationsFranceFrench PolynesiaGabonGambia, TheGeorgiaGermanyGhanaGreeceGreenlandGrenadaGuamGuatemalaGuineaGuinea-BissauGuyanaHaitiHeavily indebted poor countries (HIPC)High incomeHondurasHong Kong SAR, ChinaHungaryIBRD onlyIcelandIDA & IBRD totalIDA blendIDA onlyIDA totalIndiaIndonesiaIran, Islamic Rep.IraqIrelandIsle of ManIsraelItalyJamaicaJapanJordanKazakhstanKenyaKiribatiKorea, Dem. People’s Rep.Korea, Rep.KuwaitKyrgyz RepublicLao PDRLate-demographic dividendLatin America & Caribbean Latin America & Caribbean (excluding high income)Latin America & the Caribbean (IDA & IBRD countries)LatviaLeast developed countries: UN classificationLebanonLesothoLiberiaLibyaLiechtensteinLithuaniaLow & middle incomeLow incomeLower middle incomeLuxembourgMacao SAR, ChinaMacedonia, FYRMadagascarMalawiMalaysiaMaldivesMaliMaltaMarshall IslandsMauritaniaMauritiusMexicoMicronesia, Fed. Sts.Middle East & North AfricaMiddle East & North Africa (excluding high income)Middle East & North Africa (IDA & IBRD countries)Middle incomeMoldovaMongoliaMontenegroMoroccoMozambiqueMyanmarNamibiaNauruNepalNetherlandsNew CaledoniaNew ZealandNicaraguaNigerNigeriaNorth AmericaNorthern Mariana IslandsNorwayOECD membersOmanOther small statesPacific island small statesPakistanPalauPanamaPapua New GuineaParaguayPeruPhilippinesPolandPortugalPost-demographic dividendPre-demographic dividendPuerto RicoQatarRomaniaRussian FederationRwandaSamoaSan MarinoSao Tome and PrincipeSaudi ArabiaSenegalSerbiaSeychellesSierra LeoneSlovak RepublicSloveniaSmall statesSolomon IslandsSomaliaSouth AfricaSouth AsiaSouth Asia (IDA & IBRD)South SudanSpainSri LankaSt. Kitts and NevisSt. LuciaSt. Vincent and the GrenadinesSub-Saharan Africa Sub-Saharan Africa (excluding high income)Sub-Saharan Africa (IDA & IBRD countries)SudanSurinameSwazilandSwedenSwitzerlandSyrian Arab RepublicTajikistanTanzaniaThailandTimor-LesteTogoTongaTrinidad and TobagoTunisiaTurkeyTurkmenistanTurks and Caicos IslandsTuvaluUgandaUkraineUnited Arab EmiratesUnited KingdomUnited StatesUpper middle incomeUruguayUzbekistanVanuatuVenezuela, RBVietnamVirgin Islands (U.S.)West Bank and GazaWorldYemen, Rep.ZambiaZimbabwe Timeline:
This timeline shows a graph from 1961 to 2016 of China. No data until 1960. Number of actual observations by date: 56.
Source name:
World Development Indicators
Source organization:
World Bank Staff estimates based on United Nations, World Urbanization Prospects.
Categories, topics:
Agriculture & Rural Development
Last updated:
apr 23, 2017
Indicators value changes by year
Minimum:
-2.211
jan 1, 2013
At the date of observation
Value
Absolute change
Change from previous value
jan 1, 1961
1.244
+1.244
0.0%
jan 1, 1962
-1.62
-2.864
-230.24%
jan 1, 1963
0.197
+1.817
-112.14%
jan 1, 1964
1.814
+1.617
822.7%
jan 1, 1965
1.659
-0.155
-8.52%
jan 1, 1966
2.642
+0.982
59.19%
jan 1, 1967
2.996
+0.354
13.41%
jan 1, 1968
2.729
-0.267
-8.91%
jan 1, 1969
2.768
+0.039
1.42%
jan 1, 1970
2.895
+0.128
4.61%
jan 1, 1971
2.917
+0.021
0.74%
jan 1, 1972
2.878
-0.039
-1.34%
jan 1, 1973
2.588
-0.29
-10.07%
jan 1, 1974
2.283
-0.304
-11.76%
jan 1, 1975
1.935
-0.348
-15.24%
jan 1, 1976
1.636
-0.3
-15.49%
jan 1, 1977
1.475
-0.161
-9.85%
jan 1, 1978
1.29
-0.185
-12.52%
jan 1, 1979
0.876
-0.414
-32.07%
jan 1, 1980
0.457
-0.42
-47.88%
jan 1, 1981
0.34
-0.117
-25.66%
jan 1, 1982
0.334
-0.005
-1.62%
jan 1, 1983
0.486
+0.152
45.6%
jan 1, 1984
0.629
+0.142
29.26%
jan 1, 1985
0.47
-0.159
-25.27%
jan 1, 1986
0.495
+0.026
5.45%
jan 1, 1987
0.595
+0.1
20.15%
jan 1, 1988
0.684
+0.088
14.85%
jan 1, 1989
0.662
-0.022
-3.23%
jan 1, 1990
0.559
-0.102
-15.44%
jan 1, 1991
0.465
-0.094
-16.89%
jan 1, 1992
0.175
-0.29
-62.44%
jan 1, 1993
-0.004
-0.178
-102.09%
jan 1, 1994
-0.116
-0.112
3.08K%
jan 1, 1995
-0.177
-0.061
52.84%
jan 1, 1996
-0.262
-0.084
47.51%
jan 1, 1997
-0.345
-0.083
31.82%
jan 1, 1998
-0.407
-0.062
18.05%
jan 1, 1999
-0.517
-0.11
27.11%
jan 1, 2000
-0.655
-0.137
26.54%
jan 1, 2001
-0.778
-0.123
18.82%
jan 1, 2002
-1.188
-0.41
52.74%
jan 1, 2003
-1.47
-0.282
23.73%
jan 1, 2004
-1.596
-0.125
8.54%
jan 1, 2005
-1.704
-0.108
6.78%
jan 1, 2006
-1.781
-0.077
4.53%
jan 1, 2007
-1.811
-0.03
1.7%
jan 1, 2008
-1.877
-0.066
3.66%
jan 1, 2009
-1.963
-0.086
4.57%
jan 1, 2010
-2.043
-0.08
4.06%
jan 1, 2011
-2.133
-0.09
4.43%
jan 1, 2012
-2.21
-0.076
3.57%
jan 1, 2013
-2.211
-0.002
0.08%
jan 1, 2014
-2.201
+0.011
-0.48%
jan 1, 2015
-2.182
+0.019
-0.87%
jan 1, 2016
-2.168
+0.013
-0.61%
Ranking of countries by current statistics by years


Comments: