29
/
en
AIzaSyAYiBZKx7MnpbEhh9jyipgxe19OcubqV5w
April 1, 2024
234159
Sao Tome and Principe
STP
true
2
1
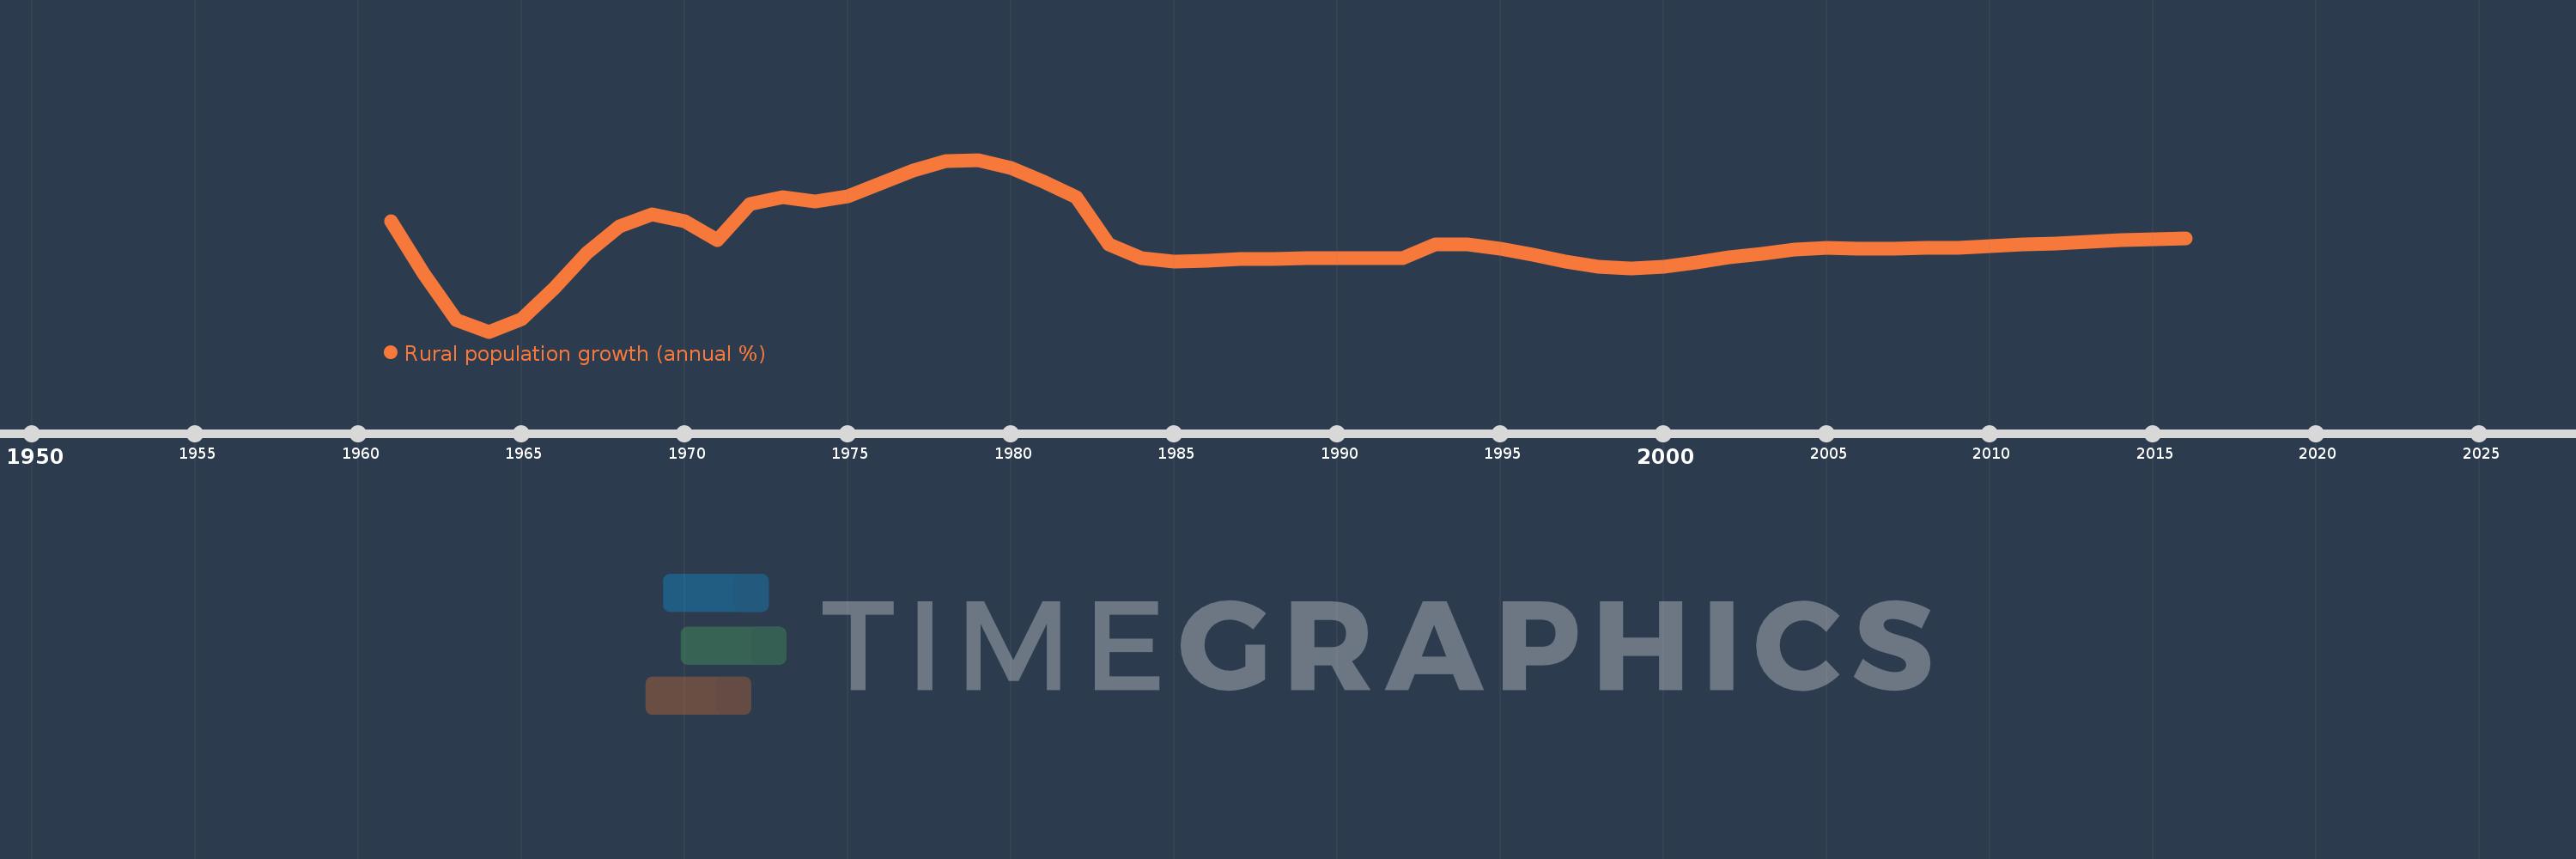
Rural population growth (annual %)
2016,2015,2014,2013,2012,2011,2010,2009,2008,2007,2006,2005,2004,2003,2002,2001,2000,1999,1998,1997,1996,1995,1994,1993,1992,1991,1990,1989,1988,1987,1986,1985,1984,1983,1982,1981,1980,1979,1978,1977,1976,1975,1974,1973,1972,1971,1970,1969,1968,1967,1966,1965,1964,1963,1962,1961
This statistics in other country:
AfghanistanAlbaniaAlgeriaAmerican SamoaAndorraAngolaAntigua and BarbudaArab WorldArgentinaArmeniaArubaAustraliaAustriaAzerbaijanBahamas, TheBahrainBangladeshBarbadosBelarusBelgiumBelizeBeninBhutanBoliviaBosnia and HerzegovinaBotswanaBrazilBritish Virgin IslandsBrunei DarussalamBulgariaBurkina FasoBurundiCabo VerdeCambodiaCameroonCanadaCaribbean small statesCentral African RepublicCentral Europe and the BalticsChadChannel IslandsChileChinaColombiaComorosCongo, Dem. Rep.Congo, Rep.Costa RicaCote d'IvoireCroatiaCubaCuracaoCyprusCzech RepublicDenmarkDjiboutiDominicaDominican RepublicEarly-demographic dividendEast Asia & PacificEast Asia & Pacific (excluding high income)East Asia & Pacific (IDA & IBRD countries)EcuadorEgypt, Arab Rep.El SalvadorEquatorial GuineaEritreaEstoniaEthiopiaEuro areaEurope & Central AsiaEurope & Central Asia (excluding high income)Europe & Central Asia (IDA & IBRD countries)European UnionFaroe IslandsFijiFinlandFragile and conflict affected situationsFranceFrench PolynesiaGabonGambia, TheGeorgiaGermanyGhanaGreeceGreenlandGrenadaGuamGuatemalaGuineaGuinea-BissauGuyanaHaitiHeavily indebted poor countries (HIPC)High incomeHondurasHong Kong SAR, ChinaHungaryIBRD onlyIcelandIDA & IBRD totalIDA blendIDA onlyIDA totalIndiaIndonesiaIran, Islamic Rep.IraqIrelandIsle of ManIsraelItalyJamaicaJapanJordanKazakhstanKenyaKiribatiKorea, Dem. People’s Rep.Korea, Rep.KuwaitKyrgyz RepublicLao PDRLate-demographic dividendLatin America & Caribbean Latin America & Caribbean (excluding high income)Latin America & the Caribbean (IDA & IBRD countries)LatviaLeast developed countries: UN classificationLebanonLesothoLiberiaLibyaLiechtensteinLithuaniaLow & middle incomeLow incomeLower middle incomeLuxembourgMacao SAR, ChinaMacedonia, FYRMadagascarMalawiMalaysiaMaldivesMaliMaltaMarshall IslandsMauritaniaMauritiusMexicoMicronesia, Fed. Sts.Middle East & North AfricaMiddle East & North Africa (excluding high income)Middle East & North Africa (IDA & IBRD countries)Middle incomeMoldovaMongoliaMontenegroMoroccoMozambiqueMyanmarNamibiaNauruNepalNetherlandsNew CaledoniaNew ZealandNicaraguaNigerNigeriaNorth AmericaNorthern Mariana IslandsNorwayOECD membersOmanOther small statesPacific island small statesPakistanPalauPanamaPapua New GuineaParaguayPeruPhilippinesPolandPortugalPost-demographic dividendPre-demographic dividendPuerto RicoQatarRomaniaRussian FederationRwandaSamoaSan MarinoSao Tome and PrincipeSaudi ArabiaSenegalSerbiaSeychellesSierra LeoneSlovak RepublicSloveniaSmall statesSolomon IslandsSomaliaSouth AfricaSouth AsiaSouth Asia (IDA & IBRD)South SudanSpainSri LankaSt. Kitts and NevisSt. LuciaSt. Vincent and the GrenadinesSub-Saharan Africa Sub-Saharan Africa (excluding high income)Sub-Saharan Africa (IDA & IBRD countries)SudanSurinameSwazilandSwedenSwitzerlandSyrian Arab RepublicTajikistanTanzaniaThailandTimor-LesteTogoTongaTrinidad and TobagoTunisiaTurkeyTurkmenistanTurks and Caicos IslandsTuvaluUgandaUkraineUnited Arab EmiratesUnited KingdomUnited StatesUpper middle incomeUruguayUzbekistanVanuatuVenezuela, RBVietnamVirgin Islands (U.S.)West Bank and GazaWorldYemen, Rep.ZambiaZimbabwe Timeline:
This timeline shows a graph from 1961 to 2016 of Sao Tome and Principe. No data until 1960. Number of actual observations by date: 56.
Source name:
World Development Indicators
Source organization:
World Bank Staff estimates based on United Nations, World Urbanization Prospects.
Categories, topics:
Agriculture & Rural Development
Last updated:
apr 23, 2017
Indicators value changes by year
Minimum:
-1.891
jan 1, 1964
At the date of observation
Value
Absolute change
Change from previous value
jan 1, 1961
0.89
+0.89
0.0%
jan 1, 1962
-0.418
-1.308
-146.96%
jan 1, 1963
-1.595
-1.177
281.6%
jan 1, 1964
-1.891
-0.295
18.52%
jan 1, 1965
-1.566
+0.325
-17.17%
jan 1, 1966
-0.798
+0.768
-49.03%
jan 1, 1967
0.101
+0.899
-112.61%
jan 1, 1968
0.77
+0.67
665.29%
jan 1, 1969
1.075
+0.304
39.52%
jan 1, 1970
0.902
-0.172
-16.05%
jan 1, 1971
0.423
-0.479
-53.09%
jan 1, 1972
1.334
+0.911
215.31%
jan 1, 1973
1.503
+0.168
12.62%
jan 1, 1974
1.391
-0.112
-7.45%
jan 1, 1975
1.536
+0.145
10.44%
jan 1, 1976
1.844
+0.308
20.08%
jan 1, 1977
2.189
+0.345
18.7%
jan 1, 1978
2.417
+0.227
10.39%
jan 1, 1979
2.451
+0.034
1.4%
jan 1, 1980
2.245
-0.205
-8.38%
jan 1, 1981
1.894
-0.351
-15.64%
jan 1, 1982
1.513
-0.381
-20.11%
jan 1, 1983
0.308
-1.205
-79.63%
jan 1, 1984
-0.04
-0.349
-113.11%
jan 1, 1985
-0.125
-0.084
207.95%
jan 1, 1986
-0.095
+0.029
-23.67%
jan 1, 1987
-0.062
+0.033
-34.37%
jan 1, 1988
-0.055
+0.008
-12.45%
jan 1, 1989
-0.045
+0.009
-17.1%
jan 1, 1990
-0.037
+0.008
-17.21%
jan 1, 1991
-0.039
-0.002
4.21%
jan 1, 1992
-0.027
+0.012
-31.98%
jan 1, 1993
0.314
+0.34
-1.28K%
jan 1, 1994
0.32
+0.007
2.16%
jan 1, 1995
0.213
-0.108
-33.67%
jan 1, 1996
0.06
-0.152
-71.57%
jan 1, 1997
-0.113
-0.174
-287.23%
jan 1, 1998
-0.242
-0.129
114.08%
jan 1, 1999
-0.3
-0.058
24.05%
jan 1, 2000
-0.259
+0.041
-13.75%
jan 1, 2001
-0.147
+0.112
-43.26%
jan 1, 2002
-0.019
+0.128
-87.22%
jan 1, 2003
0.072
+0.091
-483.23%
jan 1, 2004
0.174
+0.102
141.01%
jan 1, 2005
0.215
+0.042
24.08%
jan 1, 2006
0.213
-0.002
-0.94%
jan 1, 2007
0.207
-0.007
-3.12%
jan 1, 2008
0.215
+0.009
4.29%
jan 1, 2009
0.232
+0.017
7.67%
jan 1, 2010
0.261
+0.029
12.39%
jan 1, 2011
0.302
+0.041
15.65%
jan 1, 2012
0.345
+0.044
14.43%
jan 1, 2013
0.379
+0.034
9.82%
jan 1, 2014
0.414
+0.035
9.24%
jan 1, 2015
0.444
+0.03
7.26%
jan 1, 2016
0.474
+0.03
6.68%
Ranking of countries by current statistics by years


Comments: