29
/
en
AIzaSyAYiBZKx7MnpbEhh9jyipgxe19OcubqV5w
April 1, 2024
262954
Thailand
THA
true
2
1
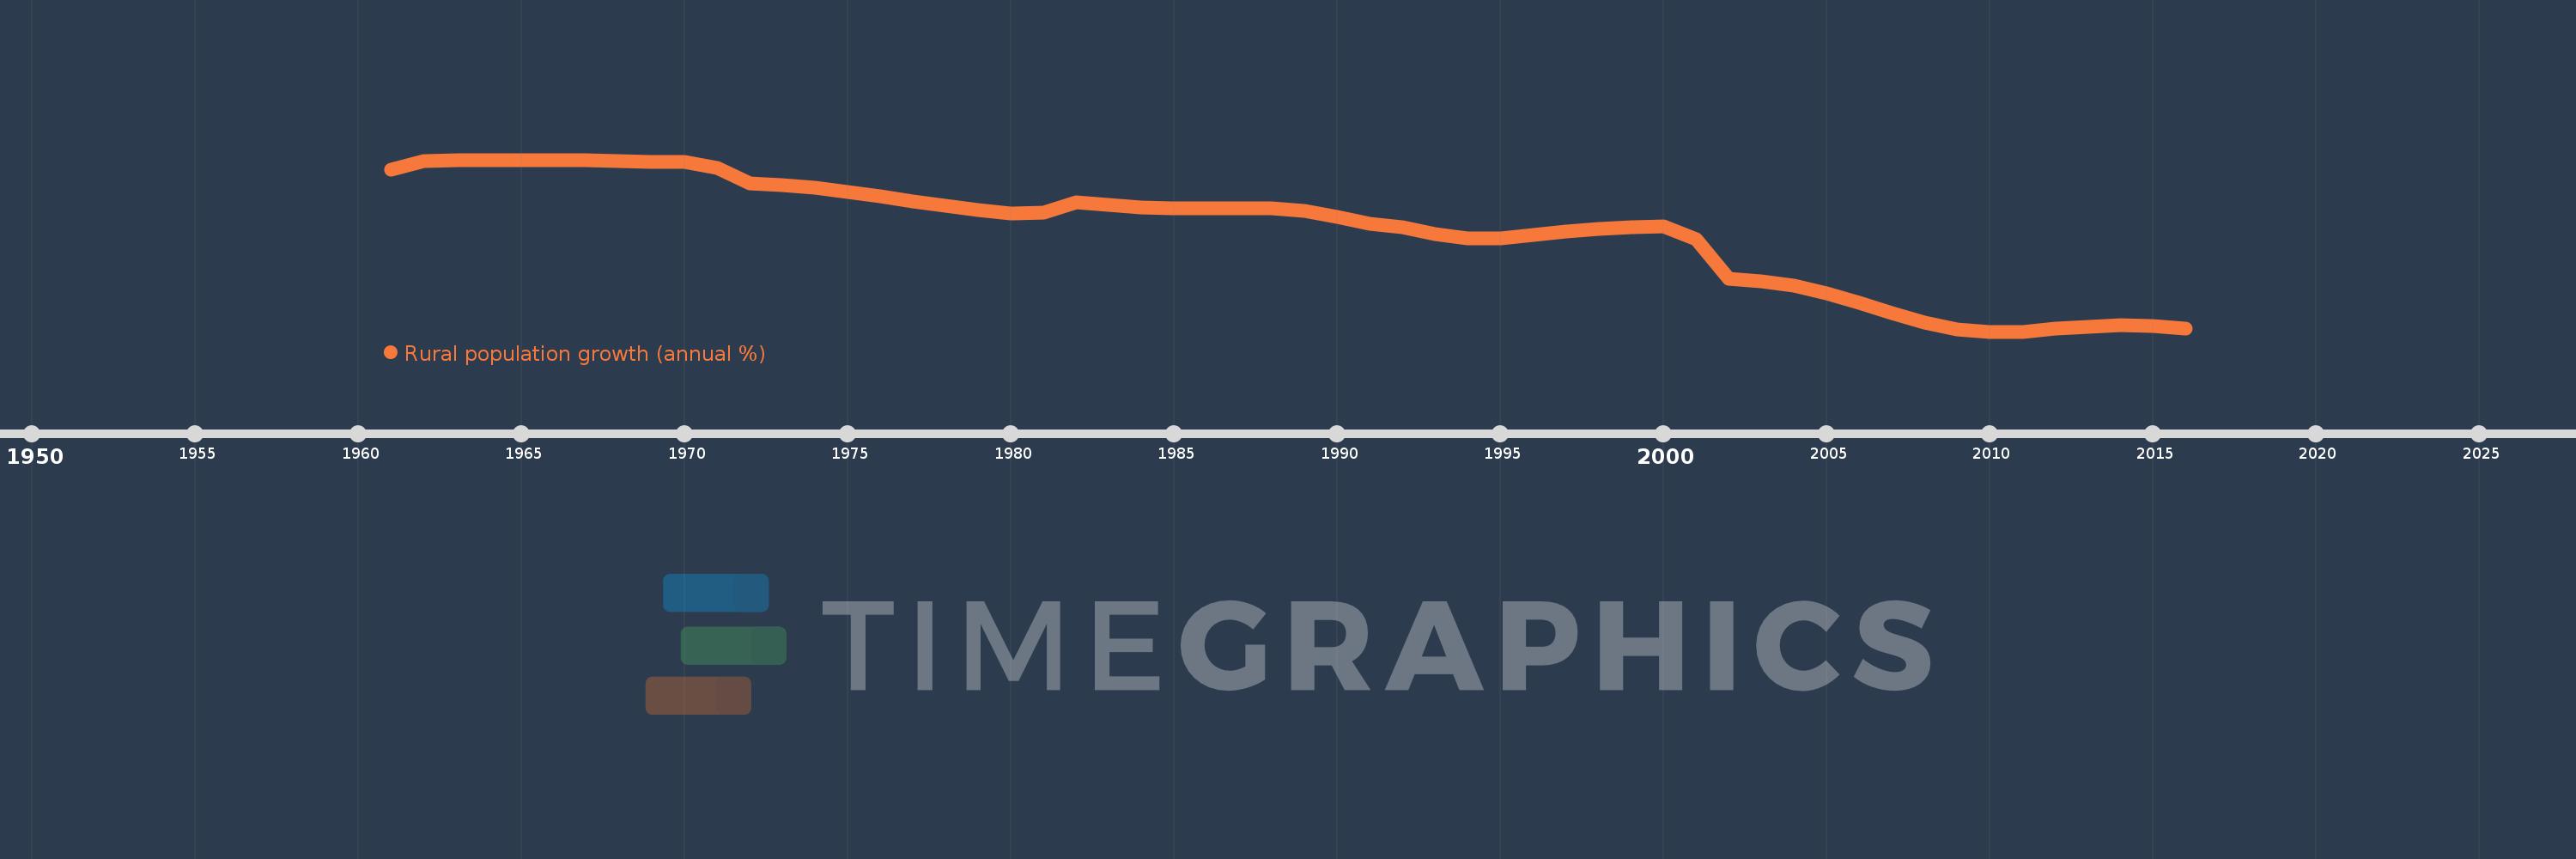
Rural population growth (annual %)
2016,2015,2014,2013,2012,2011,2010,2009,2008,2007,2006,2005,2004,2003,2002,2001,2000,1999,1998,1997,1996,1995,1994,1993,1992,1991,1990,1989,1988,1987,1986,1985,1984,1983,1982,1981,1980,1979,1978,1977,1976,1975,1974,1973,1972,1971,1970,1969,1968,1967,1966,1965,1964,1963,1962,1961
This statistics in other country:
AfghanistanAlbaniaAlgeriaAmerican SamoaAndorraAngolaAntigua and BarbudaArab WorldArgentinaArmeniaArubaAustraliaAustriaAzerbaijanBahamas, TheBahrainBangladeshBarbadosBelarusBelgiumBelizeBeninBhutanBoliviaBosnia and HerzegovinaBotswanaBrazilBritish Virgin IslandsBrunei DarussalamBulgariaBurkina FasoBurundiCabo VerdeCambodiaCameroonCanadaCaribbean small statesCentral African RepublicCentral Europe and the BalticsChadChannel IslandsChileChinaColombiaComorosCongo, Dem. Rep.Congo, Rep.Costa RicaCote d'IvoireCroatiaCubaCuracaoCyprusCzech RepublicDenmarkDjiboutiDominicaDominican RepublicEarly-demographic dividendEast Asia & PacificEast Asia & Pacific (excluding high income)East Asia & Pacific (IDA & IBRD countries)EcuadorEgypt, Arab Rep.El SalvadorEquatorial GuineaEritreaEstoniaEthiopiaEuro areaEurope & Central AsiaEurope & Central Asia (excluding high income)Europe & Central Asia (IDA & IBRD countries)European UnionFaroe IslandsFijiFinlandFragile and conflict affected situationsFranceFrench PolynesiaGabonGambia, TheGeorgiaGermanyGhanaGreeceGreenlandGrenadaGuamGuatemalaGuineaGuinea-BissauGuyanaHaitiHeavily indebted poor countries (HIPC)High incomeHondurasHong Kong SAR, ChinaHungaryIBRD onlyIcelandIDA & IBRD totalIDA blendIDA onlyIDA totalIndiaIndonesiaIran, Islamic Rep.IraqIrelandIsle of ManIsraelItalyJamaicaJapanJordanKazakhstanKenyaKiribatiKorea, Dem. People’s Rep.Korea, Rep.KuwaitKyrgyz RepublicLao PDRLate-demographic dividendLatin America & Caribbean Latin America & Caribbean (excluding high income)Latin America & the Caribbean (IDA & IBRD countries)LatviaLeast developed countries: UN classificationLebanonLesothoLiberiaLibyaLiechtensteinLithuaniaLow & middle incomeLow incomeLower middle incomeLuxembourgMacao SAR, ChinaMacedonia, FYRMadagascarMalawiMalaysiaMaldivesMaliMaltaMarshall IslandsMauritaniaMauritiusMexicoMicronesia, Fed. Sts.Middle East & North AfricaMiddle East & North Africa (excluding high income)Middle East & North Africa (IDA & IBRD countries)Middle incomeMoldovaMongoliaMontenegroMoroccoMozambiqueMyanmarNamibiaNauruNepalNetherlandsNew CaledoniaNew ZealandNicaraguaNigerNigeriaNorth AmericaNorthern Mariana IslandsNorwayOECD membersOmanOther small statesPacific island small statesPakistanPalauPanamaPapua New GuineaParaguayPeruPhilippinesPolandPortugalPost-demographic dividendPre-demographic dividendPuerto RicoQatarRomaniaRussian FederationRwandaSamoaSan MarinoSao Tome and PrincipeSaudi ArabiaSenegalSerbiaSeychellesSierra LeoneSlovak RepublicSloveniaSmall statesSolomon IslandsSomaliaSouth AfricaSouth AsiaSouth Asia (IDA & IBRD)South SudanSpainSri LankaSt. Kitts and NevisSt. LuciaSt. Vincent and the GrenadinesSub-Saharan Africa Sub-Saharan Africa (excluding high income)Sub-Saharan Africa (IDA & IBRD countries)SudanSurinameSwazilandSwedenSwitzerlandSyrian Arab RepublicTajikistanTanzaniaThailandTimor-LesteTogoTongaTrinidad and TobagoTunisiaTurkeyTurkmenistanTurks and Caicos IslandsTuvaluUgandaUkraineUnited Arab EmiratesUnited KingdomUnited StatesUpper middle incomeUruguayUzbekistanVanuatuVenezuela, RBVietnamVirgin Islands (U.S.)West Bank and GazaWorldYemen, Rep.ZambiaZimbabwe Timeline:
This timeline shows a graph from 1961 to 2016 of Thailand. No data until 1960. Number of actual observations by date: 56.
Source name:
World Development Indicators
Source organization:
World Bank Staff estimates based on United Nations, World Urbanization Prospects.
Categories, topics:
Agriculture & Rural Development
Last updated:
apr 23, 2017
Indicators value changes by year
Minimum:
-2.145
jan 1, 2011
At the date of observation
Value
Absolute change
Change from previous value
jan 1, 1961
2.578
+2.578
0.0%
jan 1, 1962
2.838
+0.26
10.1%
jan 1, 1963
2.855
+0.016
0.58%
jan 1, 1964
2.864
+0.009
0.32%
jan 1, 1965
2.868
+0.004
0.14%
jan 1, 1966
2.864
-0.004
-0.13%
jan 1, 1967
2.852
-0.012
-0.42%
jan 1, 1968
2.832
-0.02
-0.7%
jan 1, 1969
2.812
-0.02
-0.7%
jan 1, 1970
2.793
-0.02
-0.7%
jan 1, 1971
2.632
-0.161
-5.77%
jan 1, 1972
2.185
-0.447
-16.99%
jan 1, 1973
2.128
-0.056
-2.58%
jan 1, 1974
2.047
-0.081
-3.81%
jan 1, 1975
1.93
-0.117
-5.71%
jan 1, 1976
1.797
-0.133
-6.9%
jan 1, 1977
1.655
-0.142
-7.9%
jan 1, 1978
1.528
-0.127
-7.68%
jan 1, 1979
1.405
-0.123
-8.05%
jan 1, 1980
1.295
-0.11
-7.82%
jan 1, 1981
1.328
+0.033
2.52%
jan 1, 1982
1.635
+0.308
23.16%
jan 1, 1983
1.547
-0.088
-5.37%
jan 1, 1984
1.486
-0.062
-4.0%
jan 1, 1985
1.457
-0.028
-1.89%
jan 1, 1986
1.45
-0.008
-0.52%
jan 1, 1987
1.46
+0.01
0.68%
jan 1, 1988
1.453
-0.007
-0.49%
jan 1, 1989
1.374
-0.078
-5.38%
jan 1, 1990
1.207
-0.167
-12.15%
jan 1, 1991
1.007
-0.201
-16.62%
jan 1, 1992
0.89
-0.116
-11.55%
jan 1, 1993
0.69
-0.201
-22.53%
jan 1, 1994
0.577
-0.113
-16.34%
jan 1, 1995
0.585
+0.008
1.39%
jan 1, 1996
0.676
+0.091
15.53%
jan 1, 1997
0.78
+0.104
15.43%
jan 1, 1998
0.857
+0.077
9.83%
jan 1, 1999
0.91
+0.053
6.15%
jan 1, 2000
0.922
+0.012
1.32%
jan 1, 2001
0.541
-0.381
-41.32%
jan 1, 2002
-0.592
-1.132
-209.36%
jan 1, 2003
-0.675
-0.083
14.11%
jan 1, 2004
-0.815
-0.14
20.7%
jan 1, 2005
-1.04
-0.225
27.66%
jan 1, 2006
-1.303
-0.263
25.27%
jan 1, 2007
-1.606
-0.303
23.28%
jan 1, 2008
-1.877
-0.271
16.86%
jan 1, 2009
-2.07
-0.193
10.28%
jan 1, 2010
-2.145
-0.075
3.63%
jan 1, 2011
-2.145
0.0
0.01%
jan 1, 2012
-2.062
+0.083
-3.87%
jan 1, 2013
-1.997
+0.065
-3.14%
jan 1, 2014
-1.967
+0.031
-1.54%
jan 1, 2015
-1.987
-0.02
1.03%
jan 1, 2016
-2.045
-0.058
2.94%
Ranking of countries by current statistics by years


Comments: