29
/
en
AIzaSyAYiBZKx7MnpbEhh9jyipgxe19OcubqV5w
April 1, 2024
169507
Korea, Dem. People’s Rep.
PRK
true
2
1
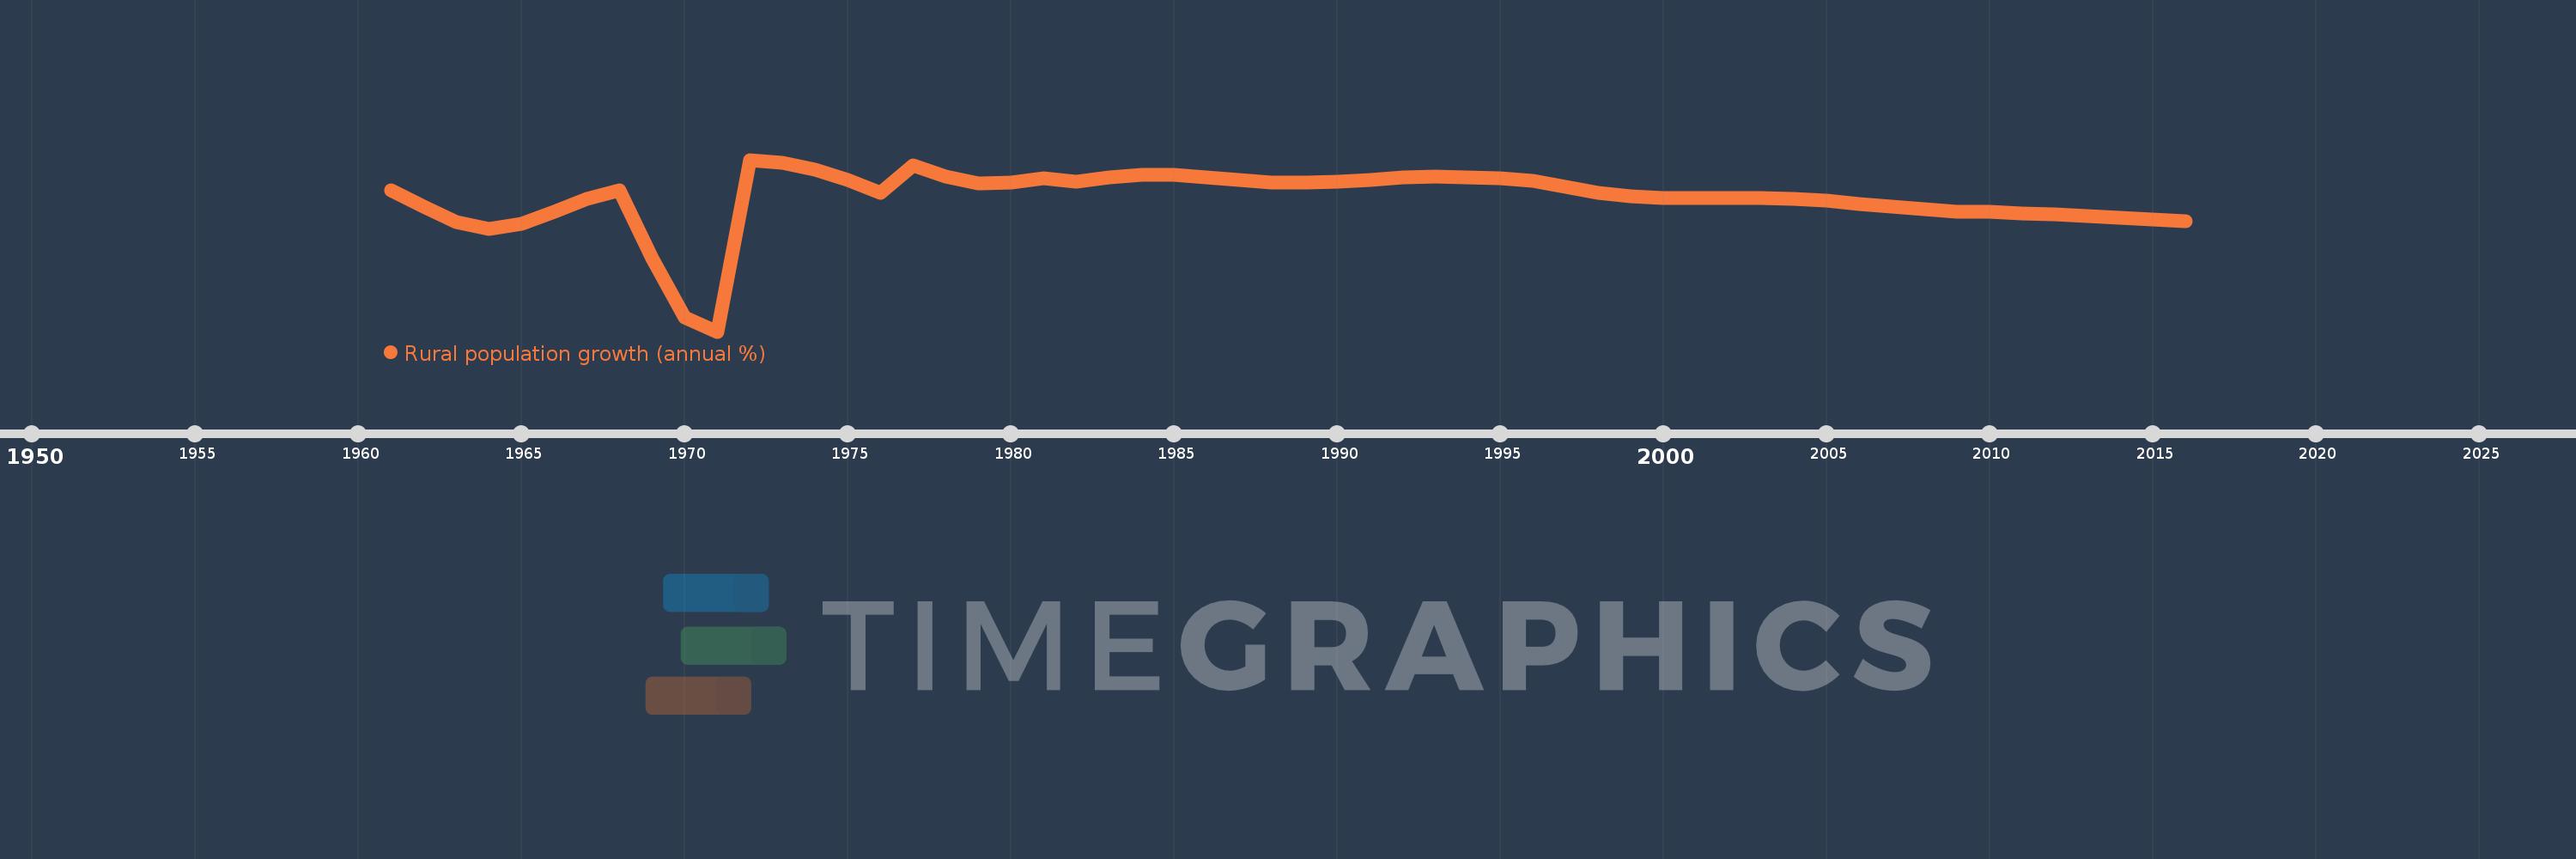
Rural population growth (annual %)
2016,2015,2014,2013,2012,2011,2010,2009,2008,2007,2006,2005,2004,2003,2002,2001,2000,1999,1998,1997,1996,1995,1994,1993,1992,1991,1990,1989,1988,1987,1986,1985,1984,1983,1982,1981,1980,1979,1978,1977,1976,1975,1974,1973,1972,1971,1970,1969,1968,1967,1966,1965,1964,1963,1962,1961
This statistics in other country:
AfghanistanAlbaniaAlgeriaAmerican SamoaAndorraAngolaAntigua and BarbudaArab WorldArgentinaArmeniaArubaAustraliaAustriaAzerbaijanBahamas, TheBahrainBangladeshBarbadosBelarusBelgiumBelizeBeninBhutanBoliviaBosnia and HerzegovinaBotswanaBrazilBritish Virgin IslandsBrunei DarussalamBulgariaBurkina FasoBurundiCabo VerdeCambodiaCameroonCanadaCaribbean small statesCentral African RepublicCentral Europe and the BalticsChadChannel IslandsChileChinaColombiaComorosCongo, Dem. Rep.Congo, Rep.Costa RicaCote d'IvoireCroatiaCubaCuracaoCyprusCzech RepublicDenmarkDjiboutiDominicaDominican RepublicEarly-demographic dividendEast Asia & PacificEast Asia & Pacific (excluding high income)East Asia & Pacific (IDA & IBRD countries)EcuadorEgypt, Arab Rep.El SalvadorEquatorial GuineaEritreaEstoniaEthiopiaEuro areaEurope & Central AsiaEurope & Central Asia (excluding high income)Europe & Central Asia (IDA & IBRD countries)European UnionFaroe IslandsFijiFinlandFragile and conflict affected situationsFranceFrench PolynesiaGabonGambia, TheGeorgiaGermanyGhanaGreeceGreenlandGrenadaGuamGuatemalaGuineaGuinea-BissauGuyanaHaitiHeavily indebted poor countries (HIPC)High incomeHondurasHong Kong SAR, ChinaHungaryIBRD onlyIcelandIDA & IBRD totalIDA blendIDA onlyIDA totalIndiaIndonesiaIran, Islamic Rep.IraqIrelandIsle of ManIsraelItalyJamaicaJapanJordanKazakhstanKenyaKiribatiKorea, Dem. People’s Rep.Korea, Rep.KuwaitKyrgyz RepublicLao PDRLate-demographic dividendLatin America & Caribbean Latin America & Caribbean (excluding high income)Latin America & the Caribbean (IDA & IBRD countries)LatviaLeast developed countries: UN classificationLebanonLesothoLiberiaLibyaLiechtensteinLithuaniaLow & middle incomeLow incomeLower middle incomeLuxembourgMacao SAR, ChinaMacedonia, FYRMadagascarMalawiMalaysiaMaldivesMaliMaltaMarshall IslandsMauritaniaMauritiusMexicoMicronesia, Fed. Sts.Middle East & North AfricaMiddle East & North Africa (excluding high income)Middle East & North Africa (IDA & IBRD countries)Middle incomeMoldovaMongoliaMontenegroMoroccoMozambiqueMyanmarNamibiaNauruNepalNetherlandsNew CaledoniaNew ZealandNicaraguaNigerNigeriaNorth AmericaNorthern Mariana IslandsNorwayOECD membersOmanOther small statesPacific island small statesPakistanPalauPanamaPapua New GuineaParaguayPeruPhilippinesPolandPortugalPost-demographic dividendPre-demographic dividendPuerto RicoQatarRomaniaRussian FederationRwandaSamoaSan MarinoSao Tome and PrincipeSaudi ArabiaSenegalSerbiaSeychellesSierra LeoneSlovak RepublicSloveniaSmall statesSolomon IslandsSomaliaSouth AfricaSouth AsiaSouth Asia (IDA & IBRD)South SudanSpainSri LankaSt. Kitts and NevisSt. LuciaSt. Vincent and the GrenadinesSub-Saharan Africa Sub-Saharan Africa (excluding high income)Sub-Saharan Africa (IDA & IBRD countries)SudanSurinameSwazilandSwedenSwitzerlandSyrian Arab RepublicTajikistanTanzaniaThailandTimor-LesteTogoTongaTrinidad and TobagoTunisiaTurkeyTurkmenistanTurks and Caicos IslandsTuvaluUgandaUkraineUnited Arab EmiratesUnited KingdomUnited StatesUpper middle incomeUruguayUzbekistanVanuatuVenezuela, RBVietnamVirgin Islands (U.S.)West Bank and GazaWorldYemen, Rep.ZambiaZimbabwe Timeline:
This timeline shows a graph from 1961 to 2016 of Korea, Dem. People’s Rep.. No data until 1960. Number of actual observations by date: 56.
Source name:
World Development Indicators
Source organization:
World Bank Staff estimates based on United Nations, World Urbanization Prospects.
Categories, topics:
Agriculture & Rural Development
Last updated:
apr 23, 2017
Indicators value changes by year
Minimum:
-2.679
jan 1, 1971
At the date of observation
Value
Absolute change
Change from previous value
jan 1, 1961
0.87
+0.87
0.0%
jan 1, 1962
0.461
-0.409
-47.03%
jan 1, 1963
0.082
-0.379
-82.15%
jan 1, 1964
-0.089
-0.172
-208.5%
jan 1, 1965
0.034
+0.123
-137.63%
jan 1, 1966
0.35
+0.317
942.75%
jan 1, 1967
0.671
+0.321
91.62%
jan 1, 1968
0.872
+0.201
29.88%
jan 1, 1969
-0.834
-1.706
-195.64%
jan 1, 1970
-2.327
-1.493
179.04%
jan 1, 1971
-2.679
-0.352
15.15%
jan 1, 1972
1.649
+4.328
-161.55%
jan 1, 1973
1.565
-0.084
-5.1%
jan 1, 1974
1.4
-0.165
-10.51%
jan 1, 1975
1.13
-0.27
-19.3%
jan 1, 1976
0.809
-0.322
-28.46%
jan 1, 1977
1.518
+0.71
87.81%
jan 1, 1978
1.228
-0.291
-19.15%
jan 1, 1979
1.063
-0.165
-13.41%
jan 1, 1980
1.067
+0.004
0.34%
jan 1, 1981
1.187
+0.12
11.25%
jan 1, 1982
1.089
-0.097
-8.22%
jan 1, 1983
1.206
+0.117
10.72%
jan 1, 1984
1.275
+0.069
5.76%
jan 1, 1985
1.265
-0.011
-0.84%
jan 1, 1986
1.206
-0.059
-4.66%
jan 1, 1987
1.135
-0.071
-5.89%
jan 1, 1988
1.084
-0.051
-4.45%
jan 1, 1989
1.065
-0.02
-1.8%
jan 1, 1990
1.088
+0.024
2.23%
jan 1, 1991
1.136
+0.048
4.41%
jan 1, 1992
1.198
+0.062
5.42%
jan 1, 1993
1.228
+0.03
2.53%
jan 1, 1994
1.206
-0.022
-1.82%
jan 1, 1995
1.19
-0.016
-1.34%
jan 1, 1996
1.126
-0.064
-5.36%
jan 1, 1997
0.962
-0.164
-14.57%
jan 1, 1998
0.82
-0.142
-14.73%
jan 1, 1999
0.72
-0.1
-12.23%
jan 1, 2000
0.679
-0.041
-5.74%
jan 1, 2001
0.681
+0.002
0.3%
jan 1, 2002
0.691
+0.01
1.5%
jan 1, 2003
0.689
-0.002
-0.32%
jan 1, 2004
0.668
-0.021
-2.98%
jan 1, 2005
0.612
-0.057
-8.49%
jan 1, 2006
0.54
-0.072
-11.76%
jan 1, 2007
0.459
-0.081
-15.01%
jan 1, 2008
0.396
-0.062
-13.6%
jan 1, 2009
0.35
-0.046
-11.55%
jan 1, 2010
0.331
-0.019
-5.52%
jan 1, 2011
0.296
-0.035
-10.68%
jan 1, 2012
0.266
-0.03
-10.08%
jan 1, 2013
0.232
-0.034
-12.91%
jan 1, 2014
0.196
-0.035
-15.24%
jan 1, 2015
0.154
-0.042
-21.49%
jan 1, 2016
0.104
-0.05
-32.39%
Ranking of countries by current statistics by years


Comments: