29
/
en
AIzaSyAYiBZKx7MnpbEhh9jyipgxe19OcubqV5w
April 1, 2024
255789
Swaziland
SWZ
true
2
1
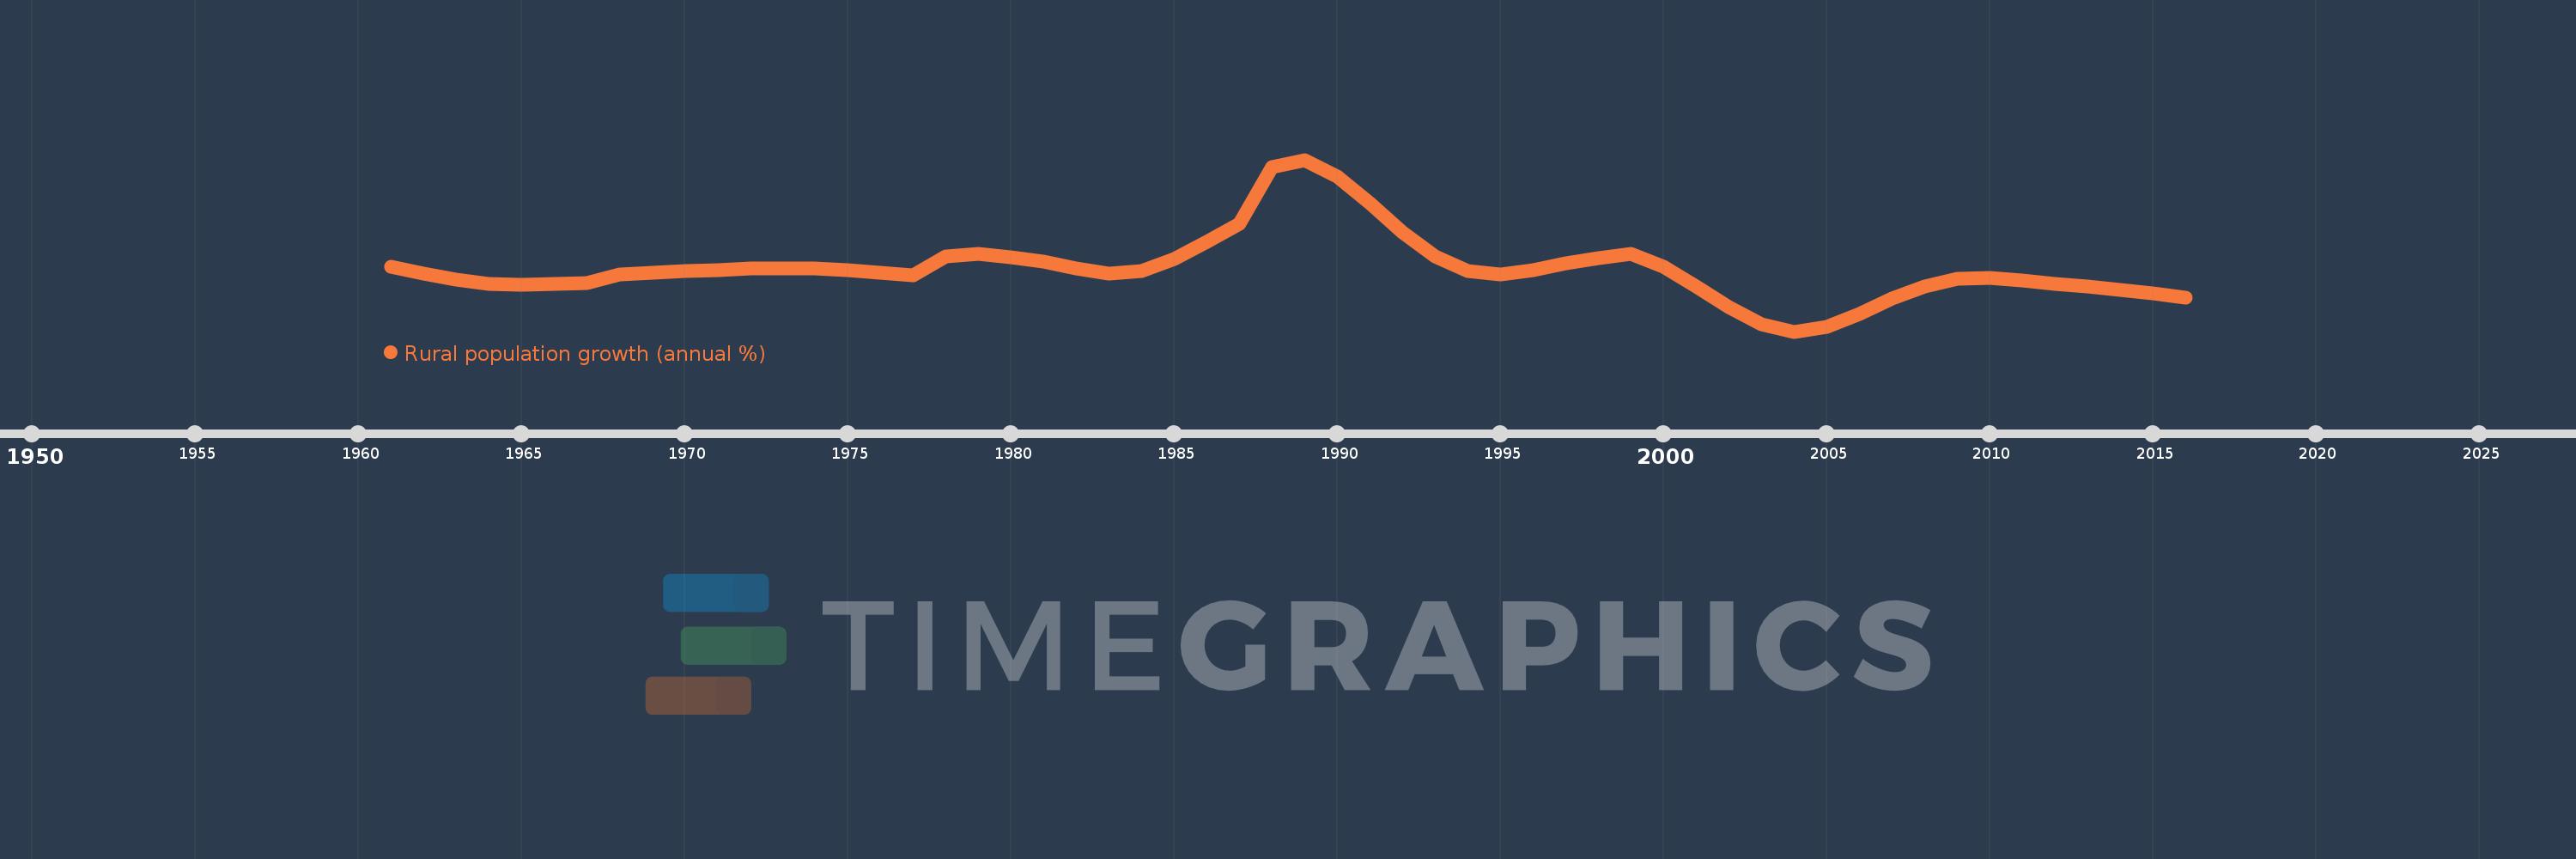
Rural population growth (annual %)
2016,2015,2014,2013,2012,2011,2010,2009,2008,2007,2006,2005,2004,2003,2002,2001,2000,1999,1998,1997,1996,1995,1994,1993,1992,1991,1990,1989,1988,1987,1986,1985,1984,1983,1982,1981,1980,1979,1978,1977,1976,1975,1974,1973,1972,1971,1970,1969,1968,1967,1966,1965,1964,1963,1962,1961
This statistics in other country:
AfghanistanAlbaniaAlgeriaAmerican SamoaAndorraAngolaAntigua and BarbudaArab WorldArgentinaArmeniaArubaAustraliaAustriaAzerbaijanBahamas, TheBahrainBangladeshBarbadosBelarusBelgiumBelizeBeninBhutanBoliviaBosnia and HerzegovinaBotswanaBrazilBritish Virgin IslandsBrunei DarussalamBulgariaBurkina FasoBurundiCabo VerdeCambodiaCameroonCanadaCaribbean small statesCentral African RepublicCentral Europe and the BalticsChadChannel IslandsChileChinaColombiaComorosCongo, Dem. Rep.Congo, Rep.Costa RicaCote d'IvoireCroatiaCubaCuracaoCyprusCzech RepublicDenmarkDjiboutiDominicaDominican RepublicEarly-demographic dividendEast Asia & PacificEast Asia & Pacific (excluding high income)East Asia & Pacific (IDA & IBRD countries)EcuadorEgypt, Arab Rep.El SalvadorEquatorial GuineaEritreaEstoniaEthiopiaEuro areaEurope & Central AsiaEurope & Central Asia (excluding high income)Europe & Central Asia (IDA & IBRD countries)European UnionFaroe IslandsFijiFinlandFragile and conflict affected situationsFranceFrench PolynesiaGabonGambia, TheGeorgiaGermanyGhanaGreeceGreenlandGrenadaGuamGuatemalaGuineaGuinea-BissauGuyanaHaitiHeavily indebted poor countries (HIPC)High incomeHondurasHong Kong SAR, ChinaHungaryIBRD onlyIcelandIDA & IBRD totalIDA blendIDA onlyIDA totalIndiaIndonesiaIran, Islamic Rep.IraqIrelandIsle of ManIsraelItalyJamaicaJapanJordanKazakhstanKenyaKiribatiKorea, Dem. People’s Rep.Korea, Rep.KuwaitKyrgyz RepublicLao PDRLate-demographic dividendLatin America & Caribbean Latin America & Caribbean (excluding high income)Latin America & the Caribbean (IDA & IBRD countries)LatviaLeast developed countries: UN classificationLebanonLesothoLiberiaLibyaLiechtensteinLithuaniaLow & middle incomeLow incomeLower middle incomeLuxembourgMacao SAR, ChinaMacedonia, FYRMadagascarMalawiMalaysiaMaldivesMaliMaltaMarshall IslandsMauritaniaMauritiusMexicoMicronesia, Fed. Sts.Middle East & North AfricaMiddle East & North Africa (excluding high income)Middle East & North Africa (IDA & IBRD countries)Middle incomeMoldovaMongoliaMontenegroMoroccoMozambiqueMyanmarNamibiaNauruNepalNetherlandsNew CaledoniaNew ZealandNicaraguaNigerNigeriaNorth AmericaNorthern Mariana IslandsNorwayOECD membersOmanOther small statesPacific island small statesPakistanPalauPanamaPapua New GuineaParaguayPeruPhilippinesPolandPortugalPost-demographic dividendPre-demographic dividendPuerto RicoQatarRomaniaRussian FederationRwandaSamoaSan MarinoSao Tome and PrincipeSaudi ArabiaSenegalSerbiaSeychellesSierra LeoneSlovak RepublicSloveniaSmall statesSolomon IslandsSomaliaSouth AfricaSouth AsiaSouth Asia (IDA & IBRD)South SudanSpainSri LankaSt. Kitts and NevisSt. LuciaSt. Vincent and the GrenadinesSub-Saharan Africa Sub-Saharan Africa (excluding high income)Sub-Saharan Africa (IDA & IBRD countries)SudanSurinameSwazilandSwedenSwitzerlandSyrian Arab RepublicTajikistanTanzaniaThailandTimor-LesteTogoTongaTrinidad and TobagoTunisiaTurkeyTurkmenistanTurks and Caicos IslandsTuvaluUgandaUkraineUnited Arab EmiratesUnited KingdomUnited StatesUpper middle incomeUruguayUzbekistanVanuatuVenezuela, RBVietnamVirgin Islands (U.S.)West Bank and GazaWorldYemen, Rep.ZambiaZimbabwe Timeline:
This timeline shows a graph from 1961 to 2016 of Swaziland. No data until 1960. Number of actual observations by date: 56.
Source name:
World Development Indicators
Source organization:
World Bank Staff estimates based on United Nations, World Urbanization Prospects.
Categories, topics:
Agriculture & Rural Development
Last updated:
apr 23, 2017
Indicators value changes by year
At the date of observation
Value
Absolute change
Change from previous value
jan 1, 1961
2.048
+2.048
0.0%
jan 1, 1962
1.905
-0.143
-6.97%
jan 1, 1963
1.78
-0.126
-6.6%
jan 1, 1964
1.698
-0.082
-4.6%
jan 1, 1965
1.672
-0.026
-1.52%
jan 1, 1966
1.688
+0.016
0.97%
jan 1, 1967
1.719
+0.031
1.82%
jan 1, 1968
1.888
+0.169
9.85%
jan 1, 1969
1.919
+0.031
1.65%
jan 1, 1970
1.955
+0.035
1.84%
jan 1, 1971
1.983
+0.028
1.45%
jan 1, 1972
2.009
+0.026
1.31%
jan 1, 1973
2.022
+0.013
0.64%
jan 1, 1974
2.017
-0.005
-0.24%
jan 1, 1975
1.979
-0.038
-1.86%
jan 1, 1976
1.921
-0.058
-2.94%
jan 1, 1977
1.87
-0.052
-2.69%
jan 1, 1978
2.268
+0.399
21.33%
jan 1, 1979
2.315
+0.047
2.06%
jan 1, 1980
2.246
-0.069
-2.98%
jan 1, 1981
2.16
-0.086
-3.83%
jan 1, 1982
2.022
-0.139
-6.41%
jan 1, 1983
1.911
-0.111
-5.47%
jan 1, 1984
1.966
+0.055
2.9%
jan 1, 1985
2.223
+0.257
13.07%
jan 1, 1986
2.576
+0.353
15.85%
jan 1, 1987
2.958
+0.382
14.83%
jan 1, 1988
4.143
+1.185
40.06%
jan 1, 1989
4.29
+0.148
3.57%
jan 1, 1990
3.932
-0.358
-8.36%
jan 1, 1991
3.376
-0.556
-14.14%
jan 1, 1992
2.768
-0.608
-18.02%
jan 1, 1993
2.268
-0.499
-18.03%
jan 1, 1994
1.957
-0.312
-13.74%
jan 1, 1995
1.888
-0.069
-3.5%
jan 1, 1996
1.977
+0.089
4.71%
jan 1, 1997
2.128
+0.151
7.62%
jan 1, 1998
2.229
+0.101
4.75%
jan 1, 1999
2.327
+0.098
4.39%
jan 1, 2000
2.045
-0.282
-12.11%
jan 1, 2001
1.644
-0.401
-19.62%
jan 1, 2002
1.203
-0.441
-26.83%
jan 1, 2003
0.857
-0.346
-28.77%
jan 1, 2004
0.696
-0.16
-18.7%
jan 1, 2005
0.793
+0.096
13.81%
jan 1, 2006
1.062
+0.269
33.94%
jan 1, 2007
1.384
+0.323
30.41%
jan 1, 2008
1.64
+0.256
18.49%
jan 1, 2009
1.796
+0.155
9.47%
jan 1, 2010
1.822
+0.027
1.48%
jan 1, 2011
1.763
-0.06
-3.28%
jan 1, 2012
1.691
-0.072
-4.07%
jan 1, 2013
1.639
-0.052
-3.06%
jan 1, 2014
1.574
-0.065
-3.99%
jan 1, 2015
1.494
-0.08
-5.05%
jan 1, 2016
1.406
-0.088
-5.89%
Ranking of countries by current statistics by years


Comments: