29
/
en
AIzaSyAYiBZKx7MnpbEhh9jyipgxe19OcubqV5w
April 1, 2024
24496
Arab World
ARB
false
2
1
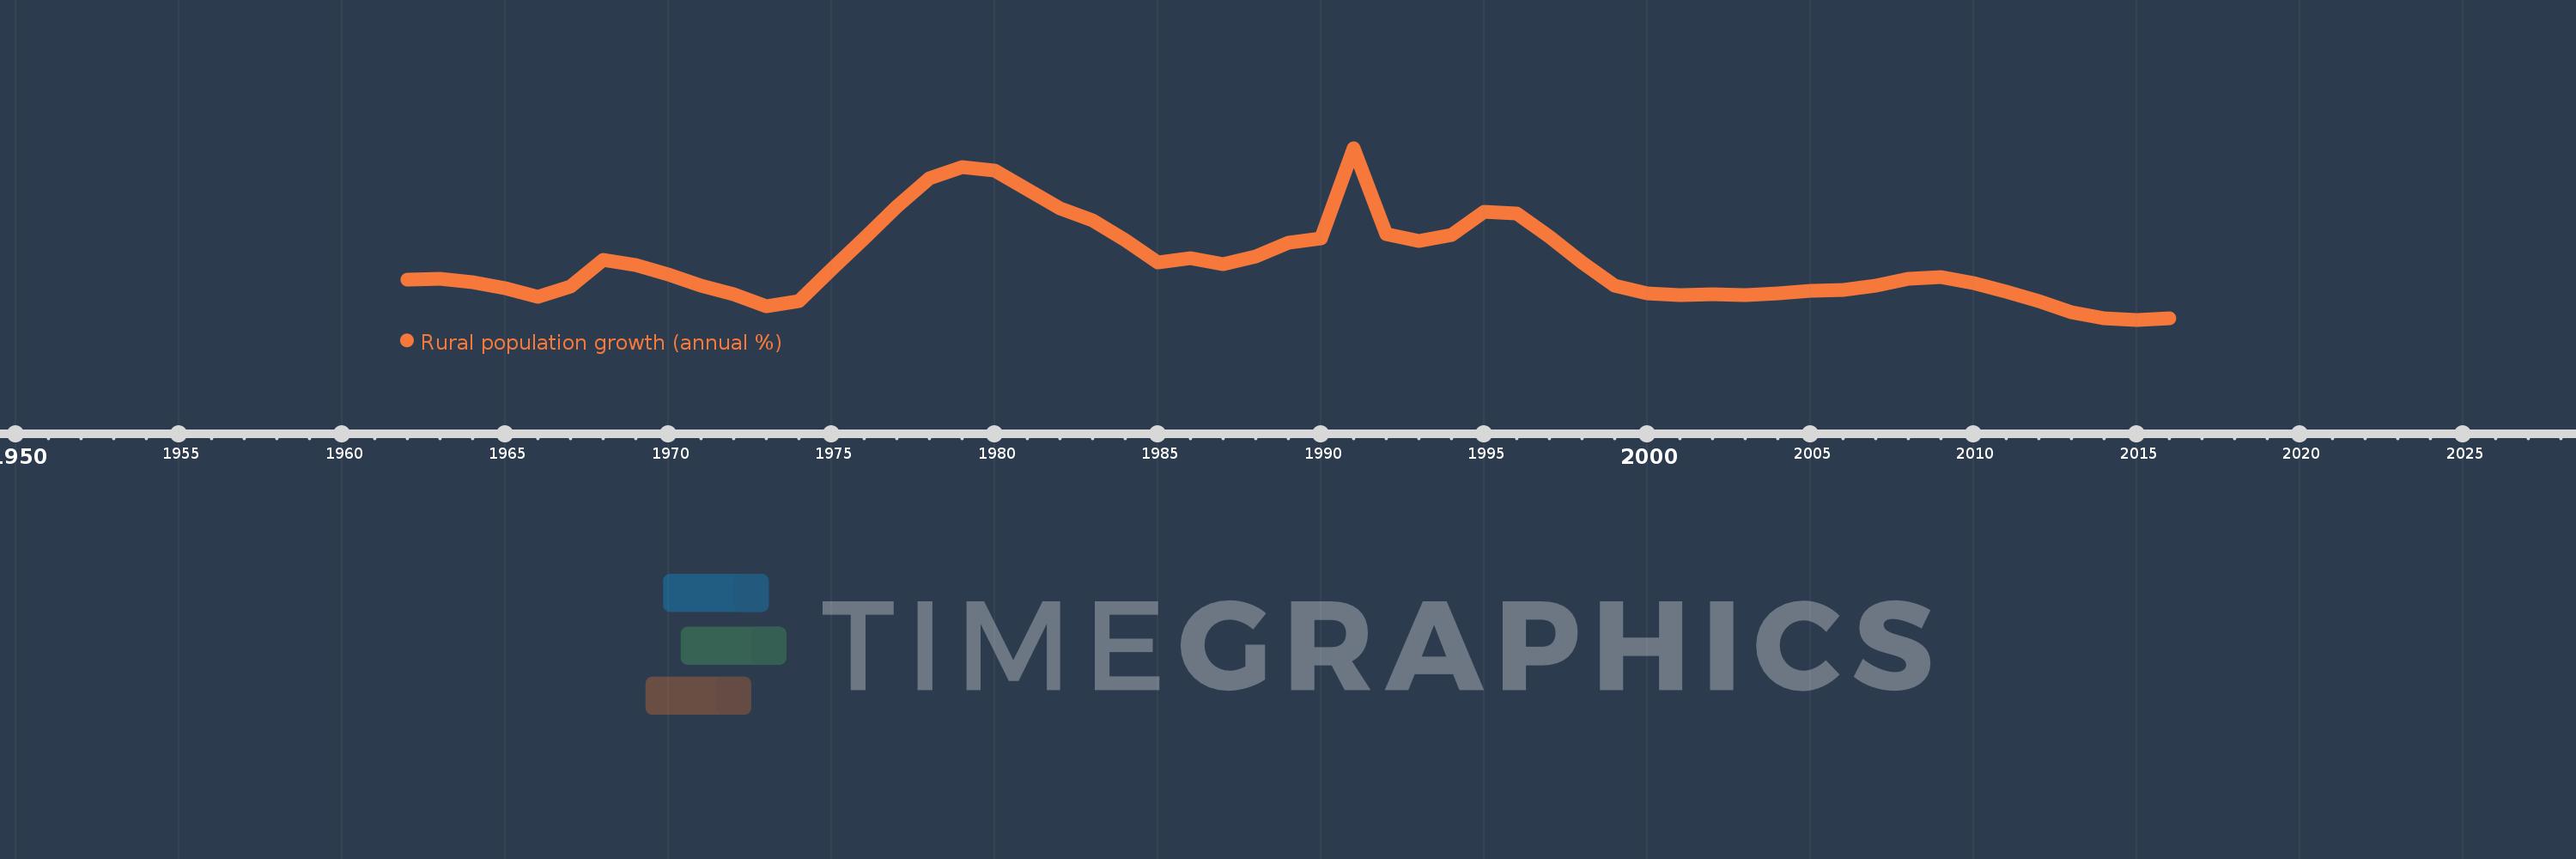
Rural population growth (annual %)
2016,2015,2014,2013,2012,2011,2010,2009,2008,2007,2006,2005,2004,2003,2002,2001,2000,1999,1998,1997,1996,1995,1994,1993,1992,1991,1990,1989,1988,1987,1986,1985,1984,1983,1982,1981,1980,1979,1978,1977,1976,1975,1974,1973,1972,1971,1970,1969,1968,1967,1966,1965,1964,1963,1962
This statistics in other country:
AfghanistanAlbaniaAlgeriaAmerican SamoaAndorraAngolaAntigua and BarbudaArab WorldArgentinaArmeniaArubaAustraliaAustriaAzerbaijanBahamas, TheBahrainBangladeshBarbadosBelarusBelgiumBelizeBeninBhutanBoliviaBosnia and HerzegovinaBotswanaBrazilBritish Virgin IslandsBrunei DarussalamBulgariaBurkina FasoBurundiCabo VerdeCambodiaCameroonCanadaCaribbean small statesCentral African RepublicCentral Europe and the BalticsChadChannel IslandsChileChinaColombiaComorosCongo, Dem. Rep.Congo, Rep.Costa RicaCote d'IvoireCroatiaCubaCuracaoCyprusCzech RepublicDenmarkDjiboutiDominicaDominican RepublicEarly-demographic dividendEast Asia & PacificEast Asia & Pacific (excluding high income)East Asia & Pacific (IDA & IBRD countries)EcuadorEgypt, Arab Rep.El SalvadorEquatorial GuineaEritreaEstoniaEthiopiaEuro areaEurope & Central AsiaEurope & Central Asia (excluding high income)Europe & Central Asia (IDA & IBRD countries)European UnionFaroe IslandsFijiFinlandFragile and conflict affected situationsFranceFrench PolynesiaGabonGambia, TheGeorgiaGermanyGhanaGreeceGreenlandGrenadaGuamGuatemalaGuineaGuinea-BissauGuyanaHaitiHeavily indebted poor countries (HIPC)High incomeHondurasHong Kong SAR, ChinaHungaryIBRD onlyIcelandIDA & IBRD totalIDA blendIDA onlyIDA totalIndiaIndonesiaIran, Islamic Rep.IraqIrelandIsle of ManIsraelItalyJamaicaJapanJordanKazakhstanKenyaKiribatiKorea, Dem. People’s Rep.Korea, Rep.KuwaitKyrgyz RepublicLao PDRLate-demographic dividendLatin America & Caribbean Latin America & Caribbean (excluding high income)Latin America & the Caribbean (IDA & IBRD countries)LatviaLeast developed countries: UN classificationLebanonLesothoLiberiaLibyaLiechtensteinLithuaniaLow & middle incomeLow incomeLower middle incomeLuxembourgMacao SAR, ChinaMacedonia, FYRMadagascarMalawiMalaysiaMaldivesMaliMaltaMarshall IslandsMauritaniaMauritiusMexicoMicronesia, Fed. Sts.Middle East & North AfricaMiddle East & North Africa (excluding high income)Middle East & North Africa (IDA & IBRD countries)Middle incomeMoldovaMongoliaMontenegroMoroccoMozambiqueMyanmarNamibiaNauruNepalNetherlandsNew CaledoniaNew ZealandNicaraguaNigerNigeriaNorth AmericaNorthern Mariana IslandsNorwayOECD membersOmanOther small statesPacific island small statesPakistanPalauPanamaPapua New GuineaParaguayPeruPhilippinesPolandPortugalPost-demographic dividendPre-demographic dividendPuerto RicoQatarRomaniaRussian FederationRwandaSamoaSan MarinoSao Tome and PrincipeSaudi ArabiaSenegalSerbiaSeychellesSierra LeoneSlovak RepublicSloveniaSmall statesSolomon IslandsSomaliaSouth AfricaSouth AsiaSouth Asia (IDA & IBRD)South SudanSpainSri LankaSt. Kitts and NevisSt. LuciaSt. Vincent and the GrenadinesSub-Saharan Africa Sub-Saharan Africa (excluding high income)Sub-Saharan Africa (IDA & IBRD countries)SudanSurinameSwazilandSwedenSwitzerlandSyrian Arab RepublicTajikistanTanzaniaThailandTimor-LesteTogoTongaTrinidad and TobagoTunisiaTurkeyTurkmenistanTurks and Caicos IslandsTuvaluUgandaUkraineUnited Arab EmiratesUnited KingdomUnited StatesUpper middle incomeUruguayUzbekistanVanuatuVenezuela, RBVietnamVirgin Islands (U.S.)West Bank and GazaWorldYemen, Rep.ZambiaZimbabwe Timeline:
This timeline shows a graph from 1962 to 2016 of Arab World. No data until 1961. Number of actual observations by date: 55.
Source name:
World Development Indicators
Source organization:
World Bank Staff estimates based on United Nations, World Urbanization Prospects.
Categories, topics:
Agriculture & Rural Development
Last updated:
apr 23, 2017
Indicators value changes by year
At the date of observation
Value
Absolute change
Change from previous value
jan 1, 1962
1.632
+1.632
0.0%
jan 1, 1963
1.639
+0.007
0.41%
jan 1, 1964
1.612
-0.027
-1.65%
jan 1, 1965
1.573
-0.039
-2.39%
jan 1, 1966
1.511
-0.062
-3.94%
jan 1, 1967
1.586
+0.074
4.9%
jan 1, 1968
1.767
+0.181
11.44%
jan 1, 1969
1.731
-0.036
-2.03%
jan 1, 1970
1.669
-0.062
-3.58%
jan 1, 1971
1.589
-0.08
-4.79%
jan 1, 1972
1.529
-0.06
-3.77%
jan 1, 1973
1.446
-0.083
-5.44%
jan 1, 1974
1.481
+0.035
2.43%
jan 1, 1975
1.704
+0.223
15.06%
jan 1, 1976
1.921
+0.216
12.69%
jan 1, 1977
2.137
+0.216
11.25%
jan 1, 1978
2.336
+0.2
9.35%
jan 1, 1979
2.413
+0.077
3.28%
jan 1, 1980
2.388
-0.025
-1.02%
jan 1, 1981
2.26
-0.129
-5.39%
jan 1, 1982
2.13
-0.13
-5.73%
jan 1, 1983
2.041
-0.089
-4.19%
jan 1, 1984
1.909
-0.132
-6.47%
jan 1, 1985
1.748
-0.161
-8.44%
jan 1, 1986
1.779
+0.031
1.78%
jan 1, 1987
1.739
-0.039
-2.21%
jan 1, 1988
1.79
+0.051
2.91%
jan 1, 1989
1.889
+0.099
5.52%
jan 1, 1990
1.919
+0.03
1.61%
jan 1, 1991
2.548
+0.629
32.76%
jan 1, 1992
1.949
-0.599
-23.51%
jan 1, 1993
1.903
-0.047
-2.39%
jan 1, 1994
1.942
+0.039
2.05%
jan 1, 1995
2.105
+0.164
8.44%
jan 1, 1996
2.094
-0.011
-0.54%
jan 1, 1997
1.932
-0.162
-7.75%
jan 1, 1998
1.749
-0.182
-9.43%
jan 1, 1999
1.588
-0.162
-9.24%
jan 1, 2000
1.537
-0.051
-3.21%
jan 1, 2001
1.525
-0.012
-0.77%
jan 1, 2002
1.529
+0.003
0.23%
jan 1, 2003
1.525
-0.004
-0.25%
jan 1, 2004
1.534
+0.009
0.62%
jan 1, 2005
1.555
+0.021
1.37%
jan 1, 2006
1.559
+0.004
0.28%
jan 1, 2007
1.588
+0.029
1.85%
jan 1, 2008
1.636
+0.048
3.03%
jan 1, 2009
1.649
+0.013
0.77%
jan 1, 2010
1.61
-0.039
-2.35%
jan 1, 2011
1.546
-0.064
-3.99%
jan 1, 2012
1.48
-0.066
-4.3%
jan 1, 2013
1.405
-0.074
-5.03%
jan 1, 2014
1.363
-0.042
-3.0%
jan 1, 2015
1.352
-0.011
-0.8%
jan 1, 2016
1.36
+0.008
0.59%
Ranking of countries by current statistics by years


Comments: