29
/
en
AIzaSyAYiBZKx7MnpbEhh9jyipgxe19OcubqV5w
April 1, 2024
138725
Georgia
GEO
true
2
1
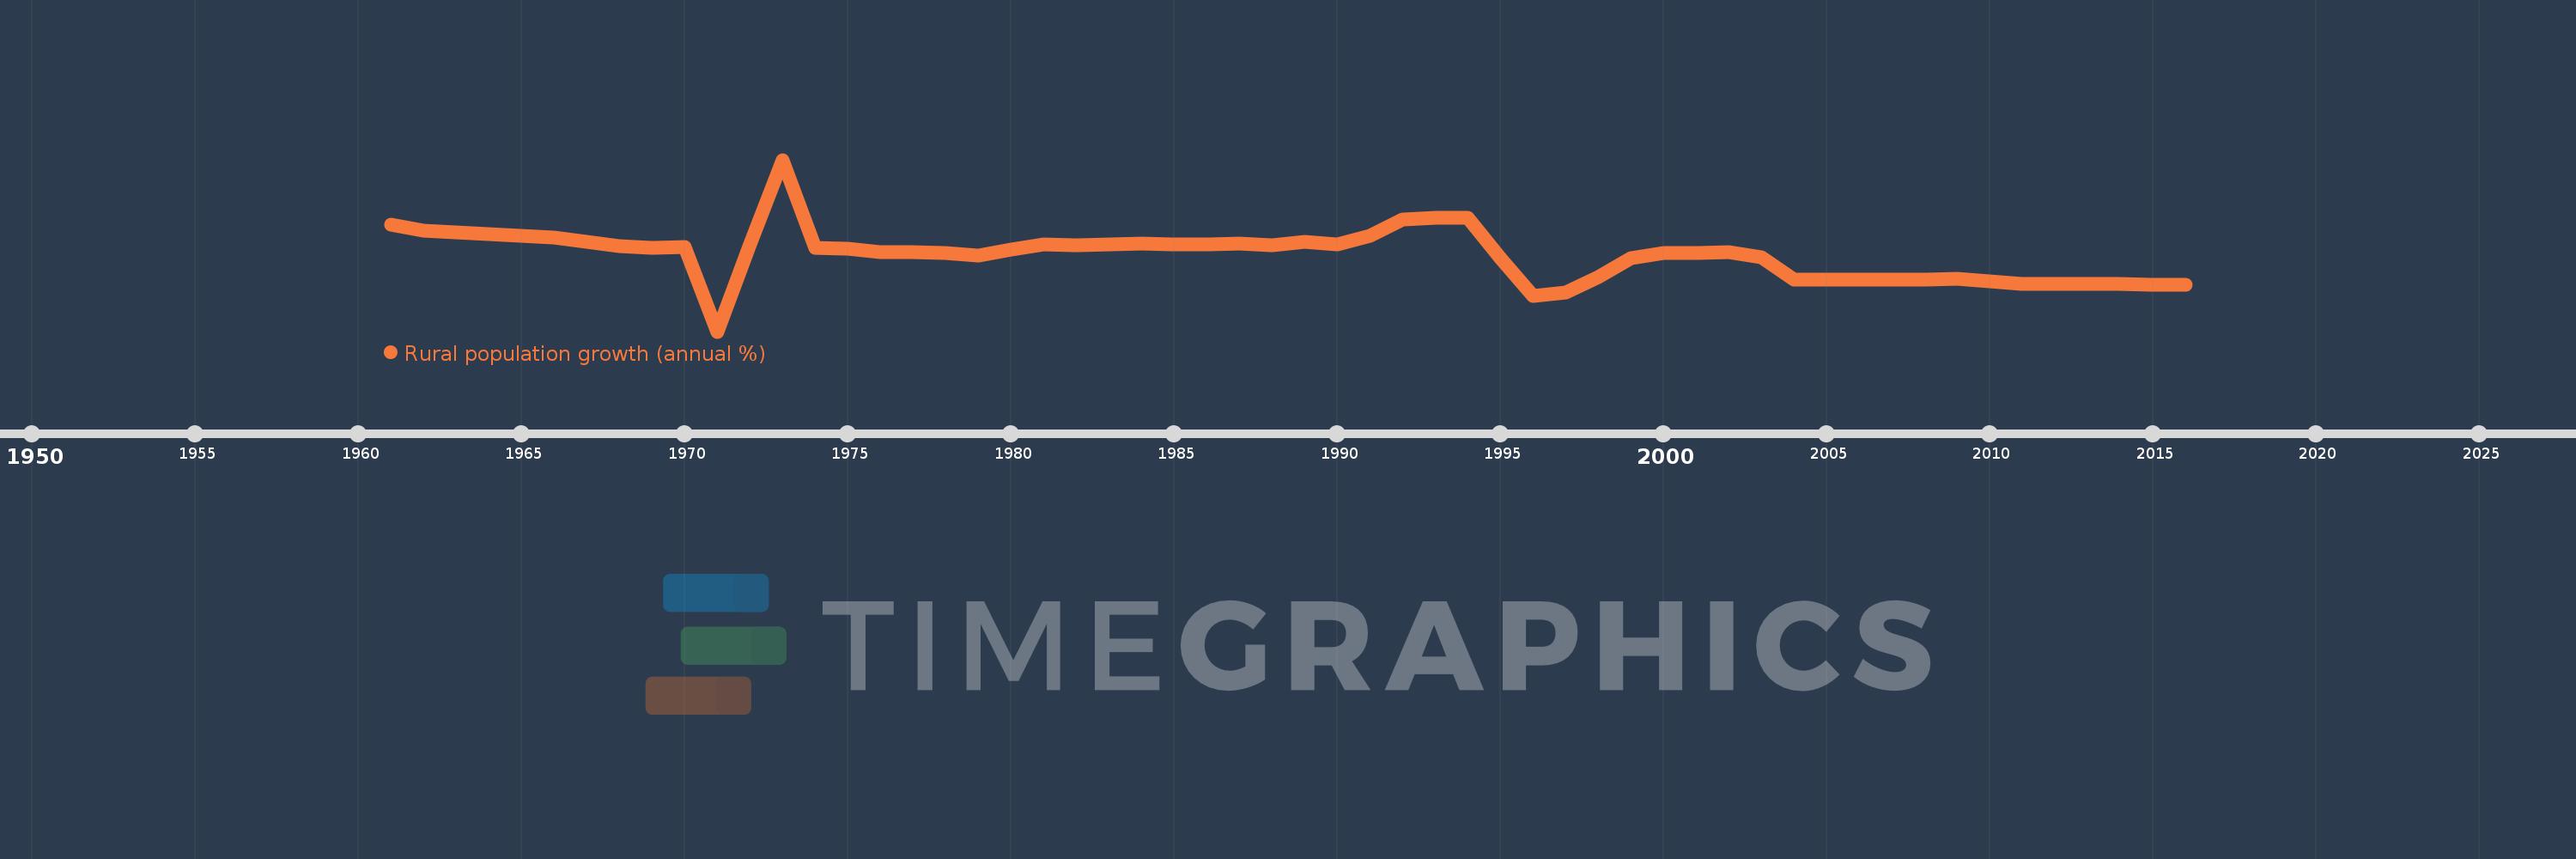
Rural population growth (annual %)
2016,2015,2014,2013,2012,2011,2010,2009,2008,2007,2006,2005,2004,2003,2002,2001,2000,1999,1998,1997,1996,1995,1994,1993,1992,1991,1990,1989,1988,1987,1986,1985,1984,1983,1982,1981,1980,1979,1978,1977,1976,1975,1974,1973,1972,1971,1970,1969,1968,1967,1966,1965,1964,1963,1962,1961
This statistics in other country:
AfghanistanAlbaniaAlgeriaAmerican SamoaAndorraAngolaAntigua and BarbudaArab WorldArgentinaArmeniaArubaAustraliaAustriaAzerbaijanBahamas, TheBahrainBangladeshBarbadosBelarusBelgiumBelizeBeninBhutanBoliviaBosnia and HerzegovinaBotswanaBrazilBritish Virgin IslandsBrunei DarussalamBulgariaBurkina FasoBurundiCabo VerdeCambodiaCameroonCanadaCaribbean small statesCentral African RepublicCentral Europe and the BalticsChadChannel IslandsChileChinaColombiaComorosCongo, Dem. Rep.Congo, Rep.Costa RicaCote d'IvoireCroatiaCubaCuracaoCyprusCzech RepublicDenmarkDjiboutiDominicaDominican RepublicEarly-demographic dividendEast Asia & PacificEast Asia & Pacific (excluding high income)East Asia & Pacific (IDA & IBRD countries)EcuadorEgypt, Arab Rep.El SalvadorEquatorial GuineaEritreaEstoniaEthiopiaEuro areaEurope & Central AsiaEurope & Central Asia (excluding high income)Europe & Central Asia (IDA & IBRD countries)European UnionFaroe IslandsFijiFinlandFragile and conflict affected situationsFranceFrench PolynesiaGabonGambia, TheGeorgiaGermanyGhanaGreeceGreenlandGrenadaGuamGuatemalaGuineaGuinea-BissauGuyanaHaitiHeavily indebted poor countries (HIPC)High incomeHondurasHong Kong SAR, ChinaHungaryIBRD onlyIcelandIDA & IBRD totalIDA blendIDA onlyIDA totalIndiaIndonesiaIran, Islamic Rep.IraqIrelandIsle of ManIsraelItalyJamaicaJapanJordanKazakhstanKenyaKiribatiKorea, Dem. People’s Rep.Korea, Rep.KuwaitKyrgyz RepublicLao PDRLate-demographic dividendLatin America & Caribbean Latin America & Caribbean (excluding high income)Latin America & the Caribbean (IDA & IBRD countries)LatviaLeast developed countries: UN classificationLebanonLesothoLiberiaLibyaLiechtensteinLithuaniaLow & middle incomeLow incomeLower middle incomeLuxembourgMacao SAR, ChinaMacedonia, FYRMadagascarMalawiMalaysiaMaldivesMaliMaltaMarshall IslandsMauritaniaMauritiusMexicoMicronesia, Fed. Sts.Middle East & North AfricaMiddle East & North Africa (excluding high income)Middle East & North Africa (IDA & IBRD countries)Middle incomeMoldovaMongoliaMontenegroMoroccoMozambiqueMyanmarNamibiaNauruNepalNetherlandsNew CaledoniaNew ZealandNicaraguaNigerNigeriaNorth AmericaNorthern Mariana IslandsNorwayOECD membersOmanOther small statesPacific island small statesPakistanPalauPanamaPapua New GuineaParaguayPeruPhilippinesPolandPortugalPost-demographic dividendPre-demographic dividendPuerto RicoQatarRomaniaRussian FederationRwandaSamoaSan MarinoSao Tome and PrincipeSaudi ArabiaSenegalSerbiaSeychellesSierra LeoneSlovak RepublicSloveniaSmall statesSolomon IslandsSomaliaSouth AfricaSouth AsiaSouth Asia (IDA & IBRD)South SudanSpainSri LankaSt. Kitts and NevisSt. LuciaSt. Vincent and the GrenadinesSub-Saharan Africa Sub-Saharan Africa (excluding high income)Sub-Saharan Africa (IDA & IBRD countries)SudanSurinameSwazilandSwedenSwitzerlandSyrian Arab RepublicTajikistanTanzaniaThailandTimor-LesteTogoTongaTrinidad and TobagoTunisiaTurkeyTurkmenistanTurks and Caicos IslandsTuvaluUgandaUkraineUnited Arab EmiratesUnited KingdomUnited StatesUpper middle incomeUruguayUzbekistanVanuatuVenezuela, RBVietnamVirgin Islands (U.S.)West Bank and GazaWorldYemen, Rep.ZambiaZimbabwe Timeline:
This timeline shows a graph from 1961 to 2016 of Georgia. No data until 1960. Number of actual observations by date: 56.
Source name:
World Development Indicators
Source organization:
World Bank Staff estimates based on United Nations, World Urbanization Prospects.
Categories, topics:
Agriculture & Rural Development
Last updated:
apr 23, 2017
Indicators value changes by year
Minimum:
-3.722
jan 1, 1971
At the date of observation
Value
Absolute change
Change from previous value
jan 1, 1961
0.987
+0.987
0.0%
jan 1, 1962
0.714
-0.273
-27.64%
jan 1, 1963
0.644
-0.07
-9.83%
jan 1, 1964
0.588
-0.056
-8.67%
jan 1, 1965
0.514
-0.074
-12.62%
jan 1, 1966
0.412
-0.102
-19.79%
jan 1, 1967
0.229
-0.183
-44.51%
jan 1, 1968
0.056
-0.173
-75.63%
jan 1, 1969
-0.029
-0.084
-151.38%
jan 1, 1970
-0.007
+0.022
-75.85%
jan 1, 1971
-3.722
-3.716
53.76K%
jan 1, 1972
0.139
+3.861
-103.73%
jan 1, 1973
3.858
+3.719
2.68K%
jan 1, 1974
-0.038
-3.896
-100.99%
jan 1, 1975
-0.059
-0.021
54.65%
jan 1, 1976
-0.2
-0.141
239.14%
jan 1, 1977
-0.226
-0.026
12.86%
jan 1, 1978
-0.272
-0.047
20.59%
jan 1, 1979
-0.381
-0.109
40.05%
jan 1, 1980
-0.115
+0.266
-69.87%
jan 1, 1981
0.128
+0.243
-211.07%
jan 1, 1982
0.104
-0.024
-18.45%
jan 1, 1983
0.123
+0.019
18.37%
jan 1, 1984
0.15
+0.027
21.79%
jan 1, 1985
0.122
-0.028
-18.74%
jan 1, 1986
0.139
+0.017
14.28%
jan 1, 1987
0.148
+0.008
5.9%
jan 1, 1988
0.079
-0.068
-46.16%
jan 1, 1989
0.238
+0.159
199.99%
jan 1, 1990
0.109
-0.13
-54.46%
jan 1, 1991
0.506
+0.397
366.16%
jan 1, 1992
1.234
+0.728
143.85%
jan 1, 1993
1.304
+0.07
5.71%
jan 1, 1994
1.293
-0.011
-0.84%
jan 1, 1995
-0.489
-1.782
-137.81%
jan 1, 1996
-2.141
-1.652
337.77%
jan 1, 1997
-2.001
+0.139
-6.51%
jan 1, 1998
-1.332
+0.67
-33.46%
jan 1, 1999
-0.469
+0.862
-64.77%
jan 1, 2000
-0.266
+0.203
-43.35%
jan 1, 2001
-0.261
+0.005
-1.8%
jan 1, 2002
-0.219
+0.042
-16.02%
jan 1, 2003
-0.452
-0.233
106.32%
jan 1, 2004
-1.417
-0.965
213.47%
jan 1, 2005
-1.434
-0.017
1.2%
jan 1, 2006
-1.428
+0.006
-0.44%
jan 1, 2007
-1.413
+0.015
-1.07%
jan 1, 2008
-1.42
-0.007
0.47%
jan 1, 2009
-1.388
+0.032
-2.26%
jan 1, 2010
-1.506
-0.118
8.52%
jan 1, 2011
-1.625
-0.119
7.93%
jan 1, 2012
-1.62
+0.005
-0.32%
jan 1, 2013
-1.61
+0.01
-0.61%
jan 1, 2014
-1.604
+0.006
-0.39%
jan 1, 2015
-1.647
-0.044
2.72%
jan 1, 2016
-1.669
-0.021
1.3%
Ranking of countries by current statistics by years


Comments: