29
/
en
AIzaSyAYiBZKx7MnpbEhh9jyipgxe19OcubqV5w
April 1, 2024
205805
Namibia
NAM
true
2
1
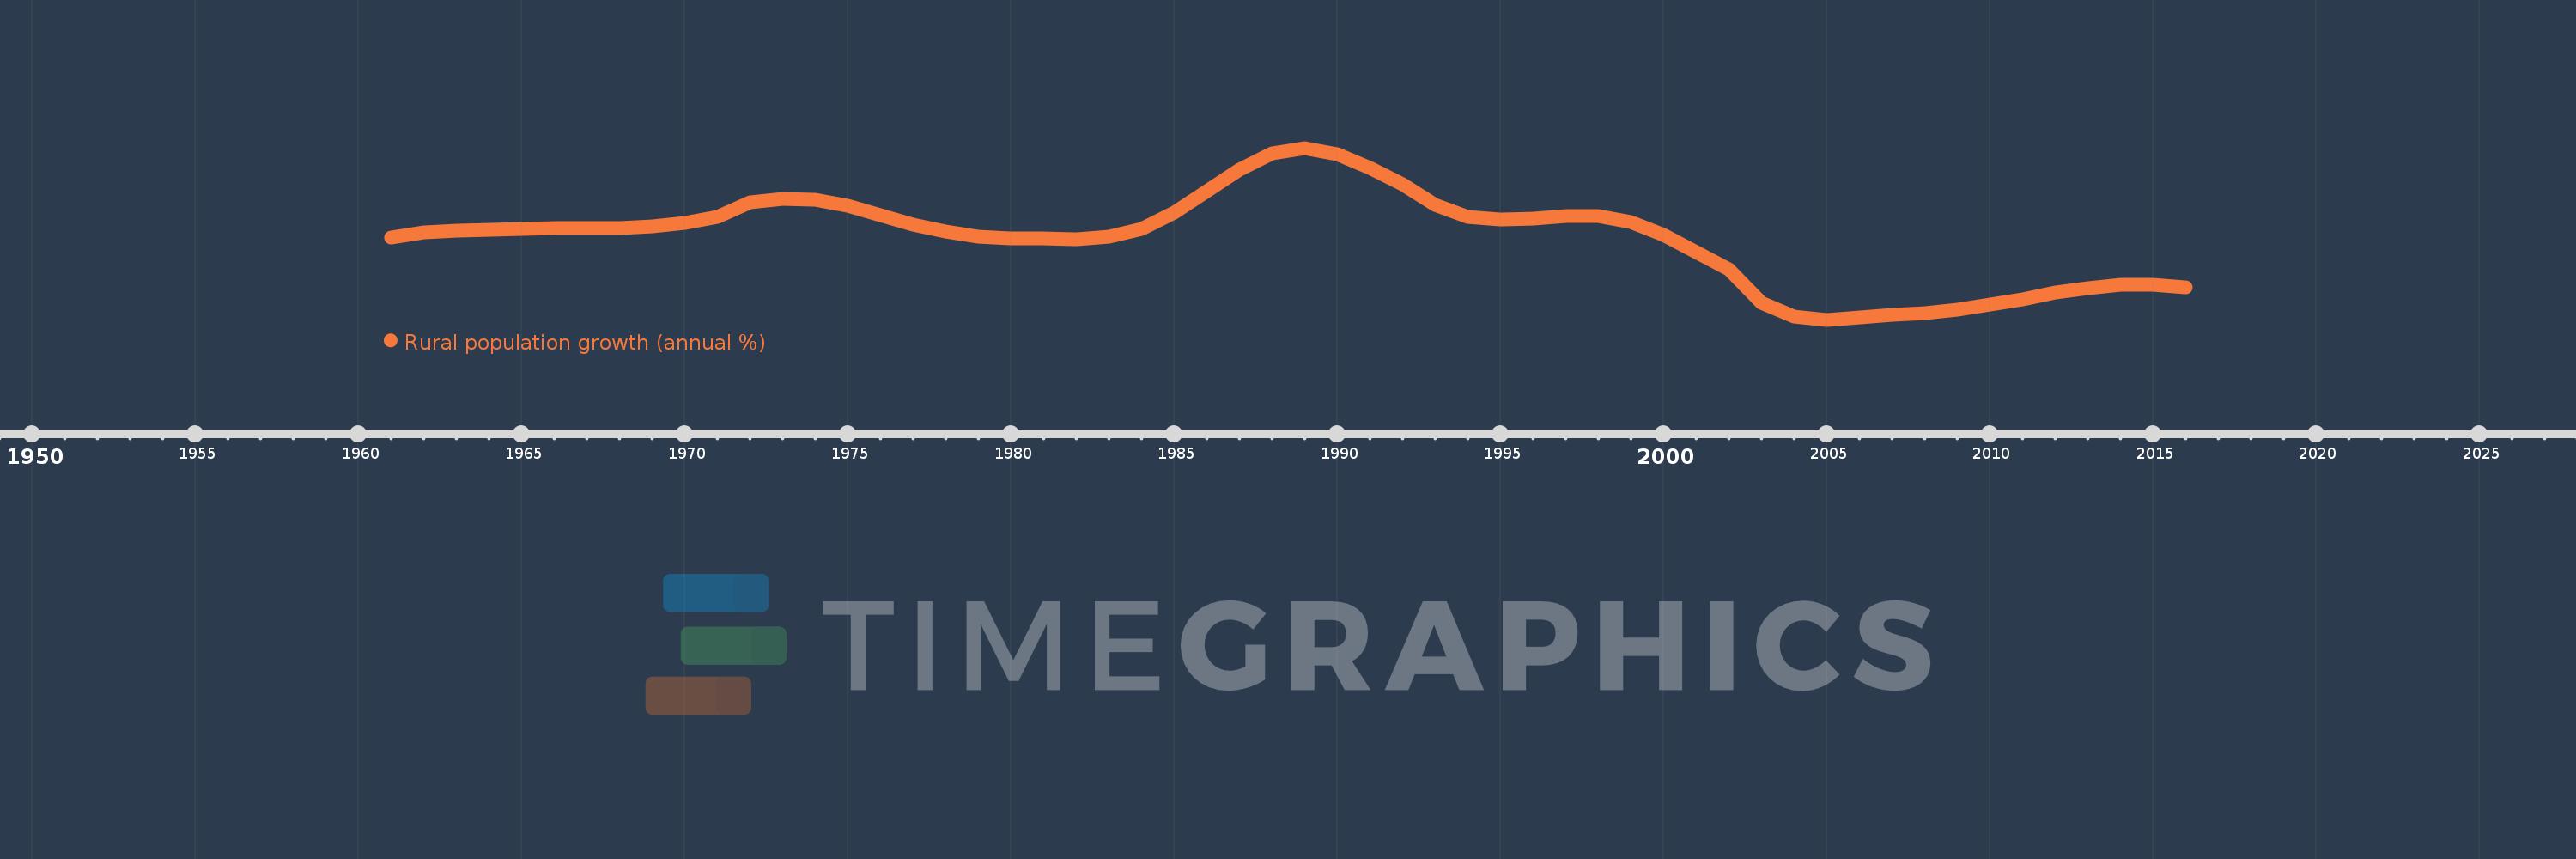
Rural population growth (annual %)
2016,2015,2014,2013,2012,2011,2010,2009,2008,2007,2006,2005,2004,2003,2002,2001,2000,1999,1998,1997,1996,1995,1994,1993,1992,1991,1990,1989,1988,1987,1986,1985,1984,1983,1982,1981,1980,1979,1978,1977,1976,1975,1974,1973,1972,1971,1970,1969,1968,1967,1966,1965,1964,1963,1962,1961
This statistics in other country:
AfghanistanAlbaniaAlgeriaAmerican SamoaAndorraAngolaAntigua and BarbudaArab WorldArgentinaArmeniaArubaAustraliaAustriaAzerbaijanBahamas, TheBahrainBangladeshBarbadosBelarusBelgiumBelizeBeninBhutanBoliviaBosnia and HerzegovinaBotswanaBrazilBritish Virgin IslandsBrunei DarussalamBulgariaBurkina FasoBurundiCabo VerdeCambodiaCameroonCanadaCaribbean small statesCentral African RepublicCentral Europe and the BalticsChadChannel IslandsChileChinaColombiaComorosCongo, Dem. Rep.Congo, Rep.Costa RicaCote d'IvoireCroatiaCubaCuracaoCyprusCzech RepublicDenmarkDjiboutiDominicaDominican RepublicEarly-demographic dividendEast Asia & PacificEast Asia & Pacific (excluding high income)East Asia & Pacific (IDA & IBRD countries)EcuadorEgypt, Arab Rep.El SalvadorEquatorial GuineaEritreaEstoniaEthiopiaEuro areaEurope & Central AsiaEurope & Central Asia (excluding high income)Europe & Central Asia (IDA & IBRD countries)European UnionFaroe IslandsFijiFinlandFragile and conflict affected situationsFranceFrench PolynesiaGabonGambia, TheGeorgiaGermanyGhanaGreeceGreenlandGrenadaGuamGuatemalaGuineaGuinea-BissauGuyanaHaitiHeavily indebted poor countries (HIPC)High incomeHondurasHong Kong SAR, ChinaHungaryIBRD onlyIcelandIDA & IBRD totalIDA blendIDA onlyIDA totalIndiaIndonesiaIran, Islamic Rep.IraqIrelandIsle of ManIsraelItalyJamaicaJapanJordanKazakhstanKenyaKiribatiKorea, Dem. People’s Rep.Korea, Rep.KuwaitKyrgyz RepublicLao PDRLate-demographic dividendLatin America & Caribbean Latin America & Caribbean (excluding high income)Latin America & the Caribbean (IDA & IBRD countries)LatviaLeast developed countries: UN classificationLebanonLesothoLiberiaLibyaLiechtensteinLithuaniaLow & middle incomeLow incomeLower middle incomeLuxembourgMacao SAR, ChinaMacedonia, FYRMadagascarMalawiMalaysiaMaldivesMaliMaltaMarshall IslandsMauritaniaMauritiusMexicoMicronesia, Fed. Sts.Middle East & North AfricaMiddle East & North Africa (excluding high income)Middle East & North Africa (IDA & IBRD countries)Middle incomeMoldovaMongoliaMontenegroMoroccoMozambiqueMyanmarNamibiaNauruNepalNetherlandsNew CaledoniaNew ZealandNicaraguaNigerNigeriaNorth AmericaNorthern Mariana IslandsNorwayOECD membersOmanOther small statesPacific island small statesPakistanPalauPanamaPapua New GuineaParaguayPeruPhilippinesPolandPortugalPost-demographic dividendPre-demographic dividendPuerto RicoQatarRomaniaRussian FederationRwandaSamoaSan MarinoSao Tome and PrincipeSaudi ArabiaSenegalSerbiaSeychellesSierra LeoneSlovak RepublicSloveniaSmall statesSolomon IslandsSomaliaSouth AfricaSouth AsiaSouth Asia (IDA & IBRD)South SudanSpainSri LankaSt. Kitts and NevisSt. LuciaSt. Vincent and the GrenadinesSub-Saharan Africa Sub-Saharan Africa (excluding high income)Sub-Saharan Africa (IDA & IBRD countries)SudanSurinameSwazilandSwedenSwitzerlandSyrian Arab RepublicTajikistanTanzaniaThailandTimor-LesteTogoTongaTrinidad and TobagoTunisiaTurkeyTurkmenistanTurks and Caicos IslandsTuvaluUgandaUkraineUnited Arab EmiratesUnited KingdomUnited StatesUpper middle incomeUruguayUzbekistanVanuatuVenezuela, RBVietnamVirgin Islands (U.S.)West Bank and GazaWorldYemen, Rep.ZambiaZimbabwe Timeline:
This timeline shows a graph from 1961 to 2016 of Namibia. No data until 1960. Number of actual observations by date: 56.
Source name:
World Development Indicators
Source organization:
World Bank Staff estimates based on United Nations, World Urbanization Prospects.
Categories, topics:
Agriculture & Rural Development
Last updated:
apr 23, 2017
Indicators value changes by year
Minimum:
-0.361
jan 1, 2005
At the date of observation
Value
Absolute change
Change from previous value
jan 1, 1961
1.764
+1.764
0.0%
jan 1, 1962
1.897
+0.133
7.54%
jan 1, 1963
1.952
+0.055
2.88%
jan 1, 1964
1.978
+0.026
1.35%
jan 1, 1965
1.998
+0.02
0.99%
jan 1, 1966
2.018
+0.02
1.01%
jan 1, 1967
2.013
-0.005
-0.23%
jan 1, 1968
2.012
-0.002
-0.09%
jan 1, 1969
2.053
+0.041
2.05%
jan 1, 1970
2.148
+0.095
4.62%
jan 1, 1971
2.306
+0.158
7.35%
jan 1, 1972
2.675
+0.37
16.04%
jan 1, 1973
2.772
+0.096
3.6%
jan 1, 1974
2.752
-0.02
-0.71%
jan 1, 1975
2.586
-0.166
-6.03%
jan 1, 1976
2.337
-0.249
-9.63%
jan 1, 1977
2.098
-0.239
-10.22%
jan 1, 1978
1.92
-0.178
-8.47%
jan 1, 1979
1.796
-0.124
-6.47%
jan 1, 1980
1.742
-0.054
-3.02%
jan 1, 1981
1.752
+0.01
0.56%
jan 1, 1982
1.732
-0.019
-1.11%
jan 1, 1983
1.79
+0.058
3.37%
jan 1, 1984
2.0
+0.209
11.69%
jan 1, 1985
2.422
+0.423
21.13%
jan 1, 1986
2.96
+0.538
22.19%
jan 1, 1987
3.525
+0.565
19.1%
jan 1, 1988
3.944
+0.419
11.88%
jan 1, 1989
4.09
+0.146
3.71%
jan 1, 1990
3.926
-0.165
-4.03%
jan 1, 1991
3.568
-0.358
-9.11%
jan 1, 1992
3.155
-0.413
-11.57%
jan 1, 1993
2.611
-0.545
-17.26%
jan 1, 1994
2.298
-0.312
-11.96%
jan 1, 1995
2.234
-0.065
-2.82%
jan 1, 1996
2.263
+0.029
1.32%
jan 1, 1997
2.325
+0.062
2.74%
jan 1, 1998
2.316
-0.009
-0.39%
jan 1, 1999
2.162
-0.154
-6.64%
jan 1, 2000
1.831
-0.331
-15.32%
jan 1, 2001
1.395
-0.436
-23.79%
jan 1, 2002
0.947
-0.448
-32.12%
jan 1, 2003
0.073
-0.874
-92.25%
jan 1, 2004
-0.277
-0.35
-477.17%
jan 1, 2005
-0.361
-0.084
30.38%
jan 1, 2006
-0.308
+0.053
-14.77%
jan 1, 2007
-0.238
+0.07
-22.82%
jan 1, 2008
-0.182
+0.056
-23.46%
jan 1, 2009
-0.091
+0.091
-50.02%
jan 1, 2010
0.042
+0.132
-145.71%
jan 1, 2011
0.176
+0.135
324.77%
jan 1, 2012
0.334
+0.158
89.37%
jan 1, 2013
0.462
+0.128
38.26%
jan 1, 2014
0.555
+0.093
20.09%
jan 1, 2015
0.547
-0.008
-1.38%
jan 1, 2016
0.478
-0.069
-12.58%
Ranking of countries by current statistics by years


Comments: